While it's essential that the theory behind a random number generator be well understood, and that its hardware and software realisation be carefully verified to implement the theoretical design, there is no substitute for detailed statistical testing of the actual output of the generator against the expectation for genuinely random data. Although a generator's design may be simple, its implementation on a complex computer and software environment makes it vulnerable to a multitude of potential problems ranging from simple programming errors to subtle bias introduced by the behaviour of instruction and data caches in the microprocessor, interference from interrupts (if not prevented), and metastability in the logic gates which receive events from the generator.
A large data set produced by the HotBits generator has been subjected to the scrutiny of three different randomness test suites, whose results are presented below. You can download this large data set (which took almost two days to create with the HotBits generator running continuously) and subject it to your own analyses, if you are so inclined.
There are many different ways to test for randomness, but all of them, in essence, boil down to computing a mathematical metric from the data stream being tested and comparing the result with the expectation value for an infinite sequence of genuinely random data. For a truly random sequence, any value is equally probable. The sequence of bits “0000000000000000” is just as likely to occur in a random data stream as “1100100100001111”, and is no less “random”. (The latter sequence is, in fact, the first sixteen bits of the mathematical constant π in binary, whose algorithmic complexity is only modestly greater than the all zero sequence!)
Randomness can be defined only statistically over a long sequence, which is why it is essential to test a large data set. Data can fail to be random in many ways. For example, one of the most obvious tests one can apply to a sequence of binary data is to count the number of ones and zeroes: as the length of the sequence increases, the difference in these values can be used to calculate the probability the sequence is random. But this test, used in isolation, would consider a sequence of alternating zero and one bits (“0101010101010101…”) perfectly random. Hence, it must be used as part of a test battery, including other measures which are sensitive to repeating patterns, improbably long runs of zeroes and ones, and other, more subtle, deviations from randomness.
Speaking as a programmer and not a mathematician or statistician, the two widely-used randomness test batteries: Diehard and the NIST SP 800-22 Statistical Test Suite, whose results are reported below, are quite messy and fragile programs. When using them, it is wise to use data sets of the same size as those employed in the examples supplied with the programs, and to select test parameters identical to those of the examples. In my experience, deviating from the domain in which the programs are known to have been tested may yield surprising and dismaying results. Also, before testing your own data with one of these test batteries, be sure to re-run the examples in the documentation and verify that you're able to reproduce the published results; changes in compilers and libraries, file formats, and operating system compatibility issues may have to be resolved before you can obtain reliable results from these tests.
The Fourmilab ENT program is a public domain utility which tests binary data sequences, either as a series of 8 bit bytes, or as a bit stream, with five standard tests for randomness which are described in the document linked to above. These are all straightforward mathematical metrics, and while they identify major departures from randomness, may miss subtle forms of bias identified by the more comprehensive test suites. The following are the results of an ENT test of the same 11,468,800 data set used for the Diehard test battery in the next section.
Entropy = 7.999975 bits per byte.

Optimum compression would reduce the size
of this 11468800 byte file by 0 percent.

Chi square distribution for 11468800 samples is 402.53, and randomly
would exceed this value 0.01 percent of the times.

Arithmetic mean value of data bytes is 127.5423 (127.5 = random).
Monte Carlo value for Pi is 3.141486168 (error 0.00 percent).
Serial correlation coefficient is -0.000053 (totally uncorrelated = 0.0).
Professor George Marsaglia of Florida State University published the “Diehard Battery of Tests of Randomness” in 1995, as part of the Marsaglia Random Number CDROM; these programs may now be downloaded from the link above. The Diehard tests are rather “quirky” measurements of randomness compared to the mathematical properties tested by ENT. Diehard tests include items such as a spacings between birthdays in a random population, monkeys pounding on keyboards, and games of craps. These tests, however, can be exquisitely sensitive to subtle departures from randomness, and their results can all be expressed as the probability the results obtained would be observed in a genuinely random sequence. Probability values close to zero or one indicate potential problems, while probabilities in the middle of the range are expected for random sequences. Please read the “NOTE” at the top of the results presented below about interpreting the reported probability values: with hundreds of probability values computed, some may be expected, purely by chance, to be close to one or zero.
The Diehard test suite was run on a 11,468,800 byte data set extracted from the beginning of the 16,779,776 HotBits test data set. I limited the data set length to that used by other Diehard examples to avoid possible problems in the code dependent upon the size of the data set.
NOTE
Most of the tests in DIEHARD return a p-value, which
should be uniform on [0,1) if the input file contains truly
independent random bits. Those p-values are obtained by
p=1-F(X), where F is the assumed distribution of the sample
random variable X---often normal. But that assumed F is often just
an asymptotic approximation, for which the fit will be worst
in the tails. Thus you should not be surprised with occasion-
al p-values near 0 or 1, such as .0012 or .9983. When a bit
stream really FAILS BIG, you will get p`s of 0 or 1 to six
or more places. By all means, do not, as a Statistician
might, think that a p < .025 or p> .975 means that the RNG
has "failed the test at the .05 level". Such p`s happen
among the hundreds that DIEHARD produces, even with good RNGs.
So keep in mind that "p happens"
Enter the name of the file to be tested.
This must be a form="unformatted",access="direct" binary
file of about 10-12 million bytes. Enter file name:
FourmilabHotBits.32
HERE ARE YOUR CHOICES:
1 Birthday Spacings
2 Overlapping Permutations
3 Ranks of 31x31 and 32x32 matrices
4 Ranks of 6x8 Matrices
5 Monkey Tests on 20-bit Words
6 Monkey Tests OPSO,OQSO,DNA
7 Count the 1`s in a Stream of Bytes
8 Count the 1`s in Specific Bytes
9 Parking Lot Test
10 Minimum Distance Test
11 Random Spheres Test
12 The Sqeeze Test
13 Overlapping Sums Test
14 Runs Test
15 The Craps Test
16 All of the above
To choose any particular tests, enter corresponding numbers.
Enter 16 for all tests. If you want to perform all but a few
tests, enter corresponding numbers preceded by "-" sign.
Tests are executed in the order they are entered.
Enter your choices.
16
|-------------------------------------------------------------|
| This is the BIRTHDAY SPACINGS TEST |
|Choose m birthdays in a "year" of n days. List the spacings |
|between the birthdays. Let j be the number of values that |
|occur more than once in that list, then j is asymptotically |
|Poisson distributed with mean m^3/(4n). Experience shows n |
|must be quite large, say n>=2^18, for comparing the results |
|to the Poisson distribution with that mean. This test uses |
|n=2^24 and m=2^10, so that the underlying distribution for j |
|is taken to be Poisson with lambda=2^30/(2^26)=16. A sample |
|of 200 j''s is taken, and a chi-square goodness of fit test |
|provides a p value. The first test uses bits 1-24 (counting |
|from the left) from integers in the specified file. Then the|
|file is closed and reopened, then bits 2-25 of the same inte-|
|gers are used to provide birthdays, and so on to bits 9-32. |
|Each set of bits provides a p-value, and the nine p-values |
|provide a sample for a KSTEST. |
|------------------------------------------------------------ |
RESULTS OF BIRTHDAY SPACINGS TEST FOR FourmilabHotBits.32
(no_bdays=1024, no_days/yr=2^24, lambda=16.00, sample size=500)
Bits used mean chisqr p-value
1 to 24 15.86 23.2107 0.142517
2 to 25 15.81 13.7843 0.682308
3 to 26 15.76 13.6039 0.694917
4 to 27 15.55 18.6599 0.348401
5 to 28 15.63 25.9381 0.075596
6 to 29 15.83 15.1730 0.583021
7 to 30 16.18 20.5640 0.246401
8 to 31 15.95 13.3762 0.710659
9 to 32 15.92 11.0928 0.851700
degree of freedoms is: 17
---------------------------------------------------------------
p-value for KStest on those 9 p-values: 0.915681
|-------------------------------------------------------------|
| THE OVERLAPPING 5-PERMUTATION TEST |
|This is the OPERM5 test. It looks at a sequence of one mill-|
|ion 32-bit random integers. Each set of five consecutive |
|integers can be in one of 120 states, for the 5! possible or-|
|derings of five numbers. Thus the 5th, 6th, 7th,...numbers |
|each provide a state. As many thousands of state transitions |
|are observed, cumulative counts are made of the number of |
|occurences of each state. Then the quadratic form in the |
|weak inverse of the 120x120 covariance matrix yields a test |
|equivalent to the likelihood ratio test that the 120 cell |
|counts came from the specified (asymptotically) normal dis- |
|tribution with the specified 120x120 covariance matrix (with |
|rank 99). This version uses 1,000,000 integers, twice. |
|-------------------------------------------------------------|
OPERM5 test for file
(For samples of 1,000,000 consecutive 5-tuples)
sample 1
chisquare=94.907067 with df=99; p-value= 0.597706
_______________________________________________________________
sample 2
chisquare=60.297852 with df=99; p-value= 0.999246
_______________________________________________________________
|-------------------------------------------------------------|
|This is the BINARY RANK TEST for 31x31 matrices. The leftmost|
|31 bits of 31 random integers from the test sequence are used|
|to form a 31x31 binary matrix over the field {0,1}. The rank |
|is determined. That rank can be from 0 to 31, but ranks< 28 |
|are rare, and their counts are pooled with those for rank 28.|
|Ranks are found for 40,000 such random matrices and a chisqu-|
|are test is performed on counts for ranks 31,30,28 and <=28. |
|-------------------------------------------------------------|
Rank test for binary matrices (31x31) from FourmilabHotBits.32
RANK OBSERVED EXPECTED (O-E)^2/E SUM
r<=28 205 211.4 0.195 0.195
r=29 5155 5134.0 0.086 0.281
r=30 22974 23103.0 0.721 1.001
r=31 11666 11551.5 1.134 2.136
chi-square = 2.136 with df = 3; p-value = 0.545
--------------------------------------------------------------
|-------------------------------------------------------------|
|This is the BINARY RANK TEST for 32x32 matrices. A random 32x|
|32 binary matrix is formed, each row a 32-bit random integer.|
|The rank is determined. That rank can be from 0 to 32, ranks |
|less than 29 are rare, and their counts are pooled with those|
|for rank 29. Ranks are found for 40,000 such random matrices|
|and a chisquare test is performed on counts for ranks 32,31,|
|30 and <=29. |
|-------------------------------------------------------------|
Rank test for binary matrices (32x32) from FourmilabHotBits.32
RANK OBSERVED EXPECTED (O-E)^2/E SUM
r<=29 206 211.4 0.139 0.139
r=30 5042 5134.0 1.649 1.788
r=31 23133 23103.0 0.039 1.827
r=32 11619 11551.5 0.394 2.221
chi-square = 2.221 with df = 3; p-value = 0.528
--------------------------------------------------------------
|-------------------------------------------------------------|
|This is the BINARY RANK TEST for 6x8 matrices. From each of |
|six random 32-bit integers from the generator under test, a |
|specified byte is chosen, and the resulting six bytes form a |
|6x8 binary matrix whose rank is determined. That rank can be|
|from 0 to 6, but ranks 0,1,2,3 are rare; their counts are |
|pooled with those for rank 4. Ranks are found for 100,000 |
|random matrices, and a chi-square test is performed on |
|counts for ranks 6,5 and (0,...,4) (pooled together). |
|-------------------------------------------------------------|
Rank test for binary matrices (6x8) from FourmilabHotBits.32
bits 1 to 8
RANK OBSERVED EXPECTED (O-E)^2/E SUM
r<=4 924 944.3 0.436 0.436
r=5 21622 21743.9 0.683 1.120
r=6 77454 77311.8 0.262 1.381
chi-square = 1.381 with df = 2; p-value = 0.501
--------------------------------------------------------------
bits 2 to 9
RANK OBSERVED EXPECTED (O-E)^2/E SUM
r<=4 936 944.3 0.073 0.073
r=5 21877 21743.9 0.815 0.888
r=6 77187 77311.8 0.201 1.089
chi-square = 1.089 with df = 2; p-value = 0.580
--------------------------------------------------------------
bits 3 to 10
RANK OBSERVED EXPECTED (O-E)^2/E SUM
r<=4 955 944.3 0.121 0.121
r=5 21949 21743.9 1.935 2.056
r=6 77096 77311.8 0.602 2.658
chi-square = 2.658 with df = 2; p-value = 0.265
--------------------------------------------------------------
bits 4 to 11
RANK OBSERVED EXPECTED (O-E)^2/E SUM
r<=4 964 944.3 0.411 0.411
r=5 21689 21743.9 0.139 0.550
r=6 77347 77311.8 0.016 0.566
chi-square = 0.566 with df = 2; p-value = 0.754
--------------------------------------------------------------
bits 5 to 12
RANK OBSERVED EXPECTED (O-E)^2/E SUM
r<=4 945 944.3 0.001 0.001
r=5 21697 21743.9 0.101 0.102
r=6 77358 77311.8 0.028 0.129
chi-square = 0.129 with df = 2; p-value = 0.937
--------------------------------------------------------------
bits 6 to 13
RANK OBSERVED EXPECTED (O-E)^2/E SUM
r<=4 999 944.3 3.169 3.169
r=5 21929 21743.9 1.576 4.744
r=6 77072 77311.8 0.744 5.488
chi-square = 5.488 with df = 2; p-value = 0.064
--------------------------------------------------------------
bits 7 to 14
RANK OBSERVED EXPECTED (O-E)^2/E SUM
r<=4 956 944.3 0.145 0.145
r=5 21790 21743.9 0.098 0.243
r=6 77254 77311.8 0.043 0.286
chi-square = 0.286 with df = 2; p-value = 0.867
--------------------------------------------------------------
bits 8 to 15
RANK OBSERVED EXPECTED (O-E)^2/E SUM
r<=4 950 944.3 0.034 0.034
r=5 21435 21743.9 4.388 4.423
r=6 77615 77311.8 1.189 5.612
chi-square = 5.612 with df = 2; p-value = 0.060
--------------------------------------------------------------
bits 9 to 16
RANK OBSERVED EXPECTED (O-E)^2/E SUM
r<=4 950 944.3 0.034 0.034
r=5 21739 21743.9 0.001 0.036
r=6 77311 77311.8 0.000 0.036
chi-square = 0.036 with df = 2; p-value = 0.982
--------------------------------------------------------------
bits 10 to 17
RANK OBSERVED EXPECTED (O-E)^2/E SUM
r<=4 936 944.3 0.073 0.073
r=5 21681 21743.9 0.182 0.255
r=6 77383 77311.8 0.066 0.320
chi-square = 0.320 with df = 2; p-value = 0.852
--------------------------------------------------------------
bits 11 to 18
RANK OBSERVED EXPECTED (O-E)^2/E SUM
r<=4 892 944.3 2.897 2.897
r=5 21752 21743.9 0.003 2.900
r=6 77356 77311.8 0.025 2.925
chi-square = 2.925 with df = 2; p-value = 0.232
--------------------------------------------------------------
bits 12 to 19
RANK OBSERVED EXPECTED (O-E)^2/E SUM
r<=4 950 944.3 0.034 0.034
r=5 21614 21743.9 0.776 0.810
r=6 77436 77311.8 0.200 1.010
chi-square = 1.010 with df = 2; p-value = 0.604
--------------------------------------------------------------
bits 13 to 20
RANK OBSERVED EXPECTED (O-E)^2/E SUM
r<=4 945 944.3 0.001 0.001
r=5 21658 21743.9 0.339 0.340
r=6 77397 77311.8 0.094 0.434
chi-square = 0.434 with df = 2; p-value = 0.805
--------------------------------------------------------------
bits 14 to 21
RANK OBSERVED EXPECTED (O-E)^2/E SUM
r<=4 955 944.3 0.121 0.121
r=5 21683 21743.9 0.171 0.292
r=6 77362 77311.8 0.033 0.324
chi-square = 0.324 with df = 2; p-value = 0.850
--------------------------------------------------------------
bits 15 to 22
RANK OBSERVED EXPECTED (O-E)^2/E SUM
r<=4 922 944.3 0.527 0.527
r=5 21719 21743.9 0.029 0.555
r=6 77359 77311.8 0.029 0.584
chi-square = 0.584 with df = 2; p-value = 0.747
--------------------------------------------------------------
bits 16 to 23
RANK OBSERVED EXPECTED (O-E)^2/E SUM
r<=4 904 944.3 1.720 1.720
r=5 21900 21743.9 1.121 2.841
r=6 77196 77311.8 0.173 3.014
chi-square = 3.014 with df = 2; p-value = 0.222
--------------------------------------------------------------
bits 17 to 24
RANK OBSERVED EXPECTED (O-E)^2/E SUM
r<=4 924 944.3 0.436 0.436
r=5 21714 21743.9 0.041 0.478
r=6 77362 77311.8 0.033 0.510
chi-square = 0.510 with df = 2; p-value = 0.775
--------------------------------------------------------------
bits 18 to 25
RANK OBSERVED EXPECTED (O-E)^2/E SUM
r<=4 935 944.3 0.092 0.092
r=5 21747 21743.9 0.000 0.092
r=6 77318 77311.8 0.000 0.093
chi-square = 0.093 with df = 2; p-value = 0.955
--------------------------------------------------------------
bits 19 to 26
RANK OBSERVED EXPECTED (O-E)^2/E SUM
r<=4 950 944.3 0.034 0.034
r=5 21716 21743.9 0.036 0.070
r=6 77334 77311.8 0.006 0.077
chi-square = 0.077 with df = 2; p-value = 0.962
--------------------------------------------------------------
bits 20 to 27
RANK OBSERVED EXPECTED (O-E)^2/E SUM
r<=4 923 944.3 0.480 0.480
r=5 21745 21743.9 0.000 0.481
r=6 77332 77311.8 0.005 0.486
chi-square = 0.486 with df = 2; p-value = 0.784
--------------------------------------------------------------
bits 21 to 28
RANK OBSERVED EXPECTED (O-E)^2/E SUM
r<=4 889 944.3 3.238 3.238
r=5 21903 21743.9 1.164 4.403
r=6 77208 77311.8 0.139 4.542
chi-square = 4.542 with df = 2; p-value = 0.103
--------------------------------------------------------------
bits 22 to 29
RANK OBSERVED EXPECTED (O-E)^2/E SUM
r<=4 952 944.3 0.063 0.063
r=5 21753 21743.9 0.004 0.067
r=6 77295 77311.8 0.004 0.070
chi-square = 0.070 with df = 2; p-value = 0.965
--------------------------------------------------------------
bits 23 to 30
RANK OBSERVED EXPECTED (O-E)^2/E SUM
r<=4 986 944.3 1.841 1.841
r=5 22062 21743.9 4.654 6.495
r=6 76952 77311.8 1.674 8.170
chi-square = 8.170 with df = 2; p-value = 0.017
--------------------------------------------------------------
bits 24 to 31
RANK OBSERVED EXPECTED (O-E)^2/E SUM
r<=4 977 944.3 1.132 1.132
r=5 21823 21743.9 0.288 1.420
r=6 77200 77311.8 0.162 1.582
chi-square = 1.582 with df = 2; p-value = 0.453
--------------------------------------------------------------
bits 25 to 32
RANK OBSERVED EXPECTED (O-E)^2/E SUM
r<=4 968 944.3 0.595 0.595
r=5 21885 21743.9 0.916 1.510
r=6 77147 77311.8 0.351 1.862
chi-square = 1.862 with df = 2; p-value = 0.394
--------------------------------------------------------------
TEST SUMMARY, 25 tests on 100,000 random 6x8 matrices
These should be 25 uniform [0,1] random variates:
0.501240 0.580088 0.264713 0.753662 0.937402
0.064310 0.866791 0.060452 0.982397 0.851939
0.231666 0.603516 0.805025 0.850268 0.746786
0.221576 0.774874 0.954789 0.962434 0.784356
0.103210 0.965486 0.016827 0.453440 0.394211
The KS test for those 25 supposed UNI's yields
KS p-value = 0.088531
|-------------------------------------------------------------|
| THE BITSTREAM TEST |
|The file under test is viewed as a stream of bits. Call them |
|b1,b2,... . Consider an alphabet with two "letters", 0 and 1|
|and think of the stream of bits as a succession of 20-letter |
|"words", overlapping. Thus the first word is b1b2...b20, the|
|second is b2b3...b21, and so on. The bitstream test counts |
|the number of missing 20-letter (20-bit) words in a string of|
|2^21 overlapping 20-letter words. There are 2^20 possible 20|
|letter words. For a truly random string of 2^21+19 bits, the|
|number of missing words j should be (very close to) normally |
|distributed with mean 141,909 and sigma 428. Thus |
| (j-141909)/428 should be a standard normal variate (z score)|
|that leads to a uniform [0,1) p value. The test is repeated |
|twenty times. |
|-------------------------------------------------------------|
THE OVERLAPPING 20-TUPLES BITSTREAM TEST for FourmilabHotBits.32
(20 bits/word, 2097152 words 20 bitstreams. No. missing words
should average 141909.33 with sigma=428.00.)
----------------------------------------------------------------
BITSTREAM test results for FourmilabHotBits.32.
Bitstream No. missing words z-score p-value
1 142235 0.76 0.223355
2 141920 0.02 0.490055
3 142064 0.36 0.358908
4 142338 1.00 0.158277
5 141548 -0.84 0.800729
6 141988 0.18 0.427082
7 141888 -0.05 0.519874
8 141930 0.05 0.480741
9 141610 -0.70 0.757839
10 142059 0.35 0.363283
11 142442 1.24 0.106647
12 142265 0.83 0.202985
13 142704 1.86 0.031677
14 141658 -0.59 0.721472
15 141818 -0.21 0.584488
16 141810 -0.23 0.591762
17 142139 0.54 0.295768
18 142066 0.37 0.357163
19 141959 0.12 0.453806
20 141860 -0.12 0.545879
----------------------------------------------------------------
|-------------------------------------------------------------|
| OPSO means Overlapping-Pairs-Sparse-Occupancy |
|The OPSO test considers 2-letter words from an alphabet of |
|1024 letters. Each letter is determined by a specified ten |
|bits from a 32-bit integer in the sequence to be tested. OPSO|
|generates 2^21 (overlapping) 2-letter words (from 2^21+1 |
|"keystrokes") and counts the number of missing words---that |
|is 2-letter words which do not appear in the entire sequence.|
|That count should be very close to normally distributed with |
|mean 141,909, sigma 290. Thus (missingwrds-141909)/290 should|
|be a standard normal variable. The OPSO test takes 32 bits at|
|a time from the test file and uses a designated set of ten |
|consecutive bits. It then restarts the file for the next de- |
|signated 10 bits, and so on. |
|------------------------------------------------------------ |
OPSO test for file FourmilabHotBits.32
Bits used No. missing words z-score p-value
23 to 32 141580 -1.1356 0.871942
22 to 31 141827 -0.2839 0.611755
21 to 30 141592 -1.0942 0.863075
20 to 29 141567 -1.1804 0.881089
19 to 28 141530 -1.3080 0.904569
18 to 27 141664 -0.8460 0.801214
17 to 26 141445 -1.6011 0.945327
16 to 25 141851 -0.2011 0.579705
15 to 24 141327 -2.0080 0.977680
14 to 23 141867 -0.1460 0.558026
13 to 22 141517 -1.3529 0.911950
12 to 21 141589 -1.1046 0.865331
11 to 20 141630 -0.9632 0.832278
10 to 19 141897 -0.0425 0.516957
9 to 18 141473 -1.5046 0.933785
8 to 17 141741 -0.5804 0.719194
7 to 16 141697 -0.7322 0.767968
6 to 15 142348 1.5127 0.065184
5 to 14 141311 -2.0632 0.980454
4 to 13 141515 -1.3598 0.913047
3 to 12 141648 -0.9011 0.816242
2 to 11 141756 -0.5287 0.701502
1 to 10 141559 -1.2080 0.886483
-----------------------------------------------------------------
|------------------------------------------------------------ |
| OQSO means Overlapping-Quadruples-Sparse-Occupancy |
| The test OQSO is similar, except that it considers 4-letter|
|words from an alphabet of 32 letters, each letter determined |
|by a designated string of 5 consecutive bits from the test |
|file, elements of which are assumed 32-bit random integers. |
|The mean number of missing words in a sequence of 2^21 four- |
|letter words, (2^21+3 "keystrokes"), is again 141909, with |
|sigma = 295. The mean is based on theory; sigma comes from |
|extensive simulation. |
|------------------------------------------------------------ |
OQSO test for file FourmilabHotBits.32
Bits used No. missing words z-score p-value
28 to 32 141900 -0.0316 0.512615
27 to 31 141966 0.1921 0.423831
26 to 30 141500 -1.3876 0.917364
25 to 29 141357 -1.8723 0.969418
24 to 28 142099 0.6429 0.260128
23 to 27 141732 -0.6011 0.726119
22 to 26 141330 -1.9638 0.975225
21 to 25 141966 0.1921 0.423831
20 to 24 141817 -0.3130 0.622853
19 to 23 142012 0.3480 0.363907
18 to 22 142448 1.8260 0.033925
17 to 21 142369 1.5582 0.059593
16 to 20 141741 -0.5706 0.715868
15 to 19 141902 -0.0248 0.509912
14 to 18 142162 0.8565 0.195858
13 to 17 141921 0.0396 0.484222
12 to 16 142013 0.3514 0.362635
11 to 15 141955 0.1548 0.438484
10 to 14 141800 -0.3706 0.644536
9 to 13 141915 0.0192 0.492333
8 to 12 142330 1.4260 0.076934
7 to 11 142155 0.8328 0.202484
6 to 10 142132 0.7548 0.225180
5 to 9 142252 1.1616 0.122700
4 to 8 142121 0.7175 0.236525
3 to 7 142450 1.8328 0.033418
2 to 6 141697 -0.7198 0.764164
1 to 5 142027 0.3989 0.344990
-----------------------------------------------------------------
|------------------------------------------------------------ |
| The DNA test considers an alphabet of 4 letters: C,G,A,T,|
|determined by two designated bits in the sequence of random |
|integers being tested. It considers 10-letter words, so that|
|as in OPSO and OQSO, there are 2^20 possible words, and the |
|mean number of missing words from a string of 2^21 (over- |
|lapping) 10-letter words (2^21+9 "keystrokes") is 141909. |
|The standard deviation sigma=339 was determined as for OQSO |
|by simulation. (Sigma for OPSO, 290, is the true value (to |
|three places), not determined by simulation. |
|------------------------------------------------------------ |
DNA test for file FourmilabHotBits.32
Bits used No. missing words z-score p-value
31 to 32 142299 1.1495 0.125181
30 to 31 141702 -0.6116 0.729596
29 to 30 141705 -0.6027 0.726660
28 to 29 141910 0.0020 0.499211
27 to 28 141889 -0.0600 0.523910
26 to 27 141104 -2.3756 0.991240
25 to 26 142020 0.3265 0.372038
24 to 25 141725 -0.5437 0.706692
23 to 24 141376 -1.5732 0.942169
22 to 23 141444 -1.3727 0.915070
21 to 22 142121 0.6244 0.266184
20 to 21 141715 -0.5732 0.716760
19 to 20 141282 -1.8505 0.967881
18 to 19 141857 -0.1544 0.561339
17 to 18 141921 0.0344 0.486269
16 to 17 142055 0.4297 0.333705
15 to 16 142639 2.1524 0.015682
14 to 15 141865 -0.1308 0.552020
13 to 14 142382 1.3943 0.081612
12 to 13 141725 -0.5437 0.706692
11 to 12 141746 -0.4818 0.685026
10 to 11 141594 -0.9302 0.823860
9 to 10 142113 0.6008 0.273988
8 to 9 142013 0.3058 0.379874
7 to 8 141896 -0.0393 0.515683
6 to 7 141759 -0.4435 0.671280
5 to 6 141432 -1.4081 0.920442
4 to 5 141645 -0.7797 0.782226
3 to 4 142413 1.4858 0.068672
2 to 3 142099 0.5595 0.287911
1 to 2 141658 -0.7414 0.770770
-----------------------------------------------------------------
|-------------------------------------------------------------|
| This is the COUNT-THE-1''s TEST on a stream of bytes. |
|Consider the file under test as a stream of bytes (four per |
|32 bit integer). Each byte can contain from 0 to 8 1''s, |
|with probabilities 1,8,28,56,70,56,28,8,1 over 256. Now let |
|the stream of bytes provide a string of overlapping 5-letter|
|words, each "letter" taking values A,B,C,D,E. The letters are|
|determined by the number of 1''s in a byte: 0,1,or 2 yield A,|
|3 yields B, 4 yields C, 5 yields D and 6,7 or 8 yield E. Thus|
|we have a monkey at a typewriter hitting five keys with vari-|
|ous probabilities (37,56,70,56,37 over 256). There are 5^5 |
|possible 5-letter words, and from a string of 256,000 (over- |
|lapping) 5-letter words, counts are made on the frequencies |
|for each word. The quadratic form in the weak inverse of |
|the covariance matrix of the cell counts provides a chisquare|
|test: Q5-Q4, the difference of the naive Pearson sums of |
|(OBS-EXP)^2/EXP on counts for 5- and 4-letter cell counts. |
|-------------------------------------------------------------|
Test result for the byte stream from FourmilabHotBits.32
(Degrees of freedom: 5^4-5^3=2500; sample size: 2560000)
chisquare z-score p-value
2493.54 -0.091 0.536401
|-------------------------------------------------------------|
| This is the COUNT-THE-1''s TEST for specific bytes. |
|Consider the file under test as a stream of 32-bit integers. |
|From each integer, a specific byte is chosen , say the left- |
|most: bits 1 to 8. Each byte can contain from 0 to 8 1''s, |
|with probabilitie 1,8,28,56,70,56,28,8,1 over 256. Now let |
|the specified bytes from successive integers provide a string|
|of (overlapping) 5-letter words, each "letter" taking values |
|A,B,C,D,E. The letters are determined by the number of 1''s,|
|in that byte: 0,1,or 2 ---> A, 3 ---> B, 4 ---> C, 5 ---> D, |
|and 6,7 or 8 ---> E. Thus we have a monkey at a typewriter |
|hitting five keys with with various probabilities: 37,56,70, |
|56,37 over 256. There are 5^5 possible 5-letter words, and |
|from a string of 256,000 (overlapping) 5-letter words, counts|
|are made on the frequencies for each word. The quadratic form|
|in the weak inverse of the covariance matrix of the cell |
|counts provides a chisquare test: Q5-Q4, the difference of |
|the naive Pearson sums of (OBS-EXP)^2/EXP on counts for 5- |
|and 4-letter cell counts. |
|-------------------------------------------------------------|
Test results for specific bytes from FourmilabHotBits.32
(Degrees of freedom: 5^4-5^3=2500; sample size: 256000)
bits used chisquare z-score p-value
1 to 8 2370.17 -1.836 0.966830
2 to 9 2590.32 1.277 0.100746
3 to 10 2513.16 0.186 0.426206
4 to 11 2452.96 -0.665 0.747062
5 to 12 2598.68 1.396 0.081421
6 to 13 2462.08 -0.536 0.704108
7 to 14 2423.88 -1.076 0.859147
8 to 15 2596.54 1.365 0.086087
9 to 16 2501.68 0.024 0.490549
10 to 17 2475.61 -0.345 0.634949
11 to 18 2535.65 0.504 0.307060
12 to 19 2467.15 -0.465 0.678858
13 to 20 2484.22 -0.223 0.588298
14 to 21 2606.47 1.506 0.066070
15 to 22 2458.25 -0.590 0.722563
16 to 23 2546.29 0.655 0.256356
17 to 24 2531.40 0.444 0.328502
18 to 25 2519.09 0.270 0.393567
19 to 26 2526.07 0.369 0.356168
20 to 27 2595.14 1.346 0.089231
21 to 28 2443.93 -0.793 0.786095
22 to 29 2469.71 -0.428 0.665820
23 to 30 2485.01 -0.212 0.583966
24 to 31 2518.65 0.264 0.395996
25 to 32 2530.07 0.425 0.335318
|-------------------------------------------------------------|
| THIS IS A PARKING LOT TEST |
|In a square of side 100, randomly "park" a car---a circle of |
|radius 1. Then try to park a 2nd, a 3rd, and so on, each |
|time parking "by ear". That is, if an attempt to park a car |
|causes a crash with one already parked, try again at a new |
|random location. (To avoid path problems, consider parking |
|helicopters rather than cars.) Each attempt leads to either|
|a crash or a success, the latter followed by an increment to |
|the list of cars already parked. If we plot n: the number of |
|attempts, versus k: the number successfully parked, we get a |
|curve that should be similar to those provided by a perfect |
|random number generator. Theory for the behavior of such a |
|random curve seems beyond reach, and as graphics displays are|
|not available for this battery of tests, a simple characteriz|
|ation of the random experiment is used: k, the number of cars|
|successfully parked after n=12,000 attempts. Simulation shows|
|that k should average 3523 with sigma 21.9 and is very close |
|to normally distributed. Thus (k-3523)/21.9 should be a st- |
|andard normal variable, which, converted to a uniform varia- |
|ble, provides input to a KSTEST based on a sample of 10. |
|-------------------------------------------------------------|
CDPARK: result of 10 tests on file FourmilabHotBits.32
(Of 12000 tries, the average no. of successes should be
3523.0 with sigma=21.9)
No. succeses z-score p-value
3543 0.9132 0.180558
3506 -0.7763 0.781201
3533 0.4566 0.323972
3524 0.0457 0.481790
3526 0.1370 0.445521
3510 -0.5936 0.723613
3543 0.9132 0.180558
3532 0.4110 0.340551
3533 0.4566 0.323972
3533 0.4566 0.323972
Square side=100, avg. no. parked=3528.30 sample std.=11.70
p-value of the KSTEST for those 10 p-values: 0.002300
|-------------------------------------------------------------|
| THE MINIMUM DISTANCE TEST |
|It does this 100 times: choose n=8000 random points in a |
|square of side 10000. Find d, the minimum distance between |
|the (n^2-n)/2 pairs of points. If the points are truly inde-|
|pendent uniform, then d^2, the square of the minimum distance|
|should be (very close to) exponentially distributed with mean|
|.995 . Thus 1-exp(-d^2/.995) should be uniform on [0,1) and |
|a KSTEST on the resulting 100 values serves as a test of uni-|
|formity for random points in the square. Test numbers=0 mod 5|
|are printed but the KSTEST is based on the full set of 100 |
|random choices of 8000 points in the 10000x10000 square. |
|-------------------------------------------------------------|
This is the MINIMUM DISTANCE test for file FourmilabHotBits.32
Sample no. d^2 mean equiv uni
5 0.0066 0.7395 0.006640
10 3.0735 1.2046 0.954449
15 0.1273 0.9023 0.120123
20 5.4762 1.1602 0.995928
25 0.9729 1.2054 0.623852
30 0.7707 1.1989 0.539084
35 0.0274 1.2205 0.027205
40 0.0148 1.1269 0.014762
45 1.8536 1.1399 0.844779
50 0.3695 1.1442 0.310181
55 0.4188 1.1592 0.343554
60 0.2675 1.1129 0.235763
65 3.1837 1.1337 0.959224
70 2.3059 1.1826 0.901478
75 1.0426 1.1678 0.649299
80 0.0274 1.1610 0.027178
85 3.4117 1.1430 0.967576
90 3.3879 1.1558 0.966792
95 0.4765 1.1227 0.380508
100 1.1551 1.1143 0.686808
--------------------------------------------------------------
Result of KS test on 100 transformed mindist^2's: p-value=0.297975
|-------------------------------------------------------------|
| THE 3DSPHERES TEST |
|Choose 4000 random points in a cube of edge 1000. At each |
|point, center a sphere large enough to reach the next closest|
|point. Then the volume of the smallest such sphere is (very |
|close to) exponentially distributed with mean 120pi/3. Thus |
|the radius cubed is exponential with mean 30. (The mean is |
|obtained by extensive simulation). The 3DSPHERES test gener-|
|ates 4000 such spheres 20 times. Each min radius cubed leads|
|to a uniform variable by means of 1-exp(-r^3/30.), then a |
| KSTEST is done on the 20 p-values. |
|-------------------------------------------------------------|
The 3DSPHERES test for file FourmilabHotBits.32
sample no r^3 equiv. uni.
1 95.178 0.958106
2 102.500 0.967178
3 0.896 0.029438
4 47.776 0.796592
5 31.541 0.650536
6 20.136 0.488897
7 20.419 0.493707
8 7.454 0.220000
9 11.429 0.316806
10 32.907 0.666098
11 10.626 0.298265
12 38.004 0.718272
13 6.657 0.199018
14 11.230 0.312259
15 47.004 0.791291
16 1.492 0.048505
17 0.666 0.021962
18 20.268 0.491147
19 0.664 0.021891
20 42.920 0.760853
--------------------------------------------------------------
p-value for KS test on those 20 p-values: 0.539573
|-------------------------------------------------------------|
| This is the SQUEEZE test |
| Random integers are floated to get uniforms on [0,1). Start-|
| ing with k=2^31=2147483647, the test finds j, the number of |
| iterations necessary to reduce k to 1, using the reduction |
| k=ceiling(k*U), with U provided by floating integers from |
| the file being tested. Such j''s are found 100,000 times, |
| then counts for the number of times j was <=6,7,...,47,>=48 |
| are used to provide a chi-square test for cell frequencies. |
|-------------------------------------------------------------|
RESULTS OF SQUEEZE TEST FOR FourmilabHotBits.32
Table of standardized frequency counts
(obs-exp)^2/exp for j=(1,..,6), 7,...,47,(48,...)
-0.1 0.5 -1.1 0.5 -1.3 0.4
-1.4 -1.2 0.6 -0.9 -1.2 -1.9
0.7 -1.8 1.7 -2.2 0.6 1.3
0.8 -0.8 0.1 0.1 0.1 0.6
0.6 0.4 3.1 -1.7 1.0 0.0
1.4 1.0 0.2 -0.2 0.9 -1.6
1.2 -0.1 0.1 0.4 1.6 0.0
1.8
Chi-square with 42 degrees of freedom:55.429856
z-score=1.465317, p-value=0.080144
_____________________________________________________________
|-------------------------------------------------------------|
| The OVERLAPPING SUMS test |
|Integers are floated to get a sequence U(1),U(2),... of uni- |
|form [0,1) variables. Then overlapping sums, |
| S(1)=U(1)+...+U(100), S2=U(2)+...+U(101),... are formed. |
|The S''s are virtually normal with a certain covariance mat- |
|rix. A linear transformation of the S''s converts them to a |
|sequence of independent standard normals, which are converted|
|to uniform variables for a KSTEST. |
|-------------------------------------------------------------|
Results of the OSUM test for FourmilabHotBits.32
Test no p-value
1 0.222186
2 0.841877
3 0.064437
4 0.936267
5 0.676322
6 0.305676
7 0.679858
8 0.181487
9 0.992939
10 0.653249
_____________________________________________________________
p-value for 10 kstests on 100 kstests:0.642506
|-------------------------------------------------------------|
| This is the RUNS test. It counts runs up, and runs down,|
|in a sequence of uniform [0,1) variables, obtained by float- |
|ing the 32-bit integers in the specified file. This example |
|shows how runs are counted: .123,.357,.789,.425,.224,.416,.95|
|contains an up-run of length 3, a down-run of length 2 and an|
|up-run of (at least) 2, depending on the next values. The |
|covariance matrices for the runs-up and runs-down are well |
|known, leading to chisquare tests for quadratic forms in the |
|weak inverses of the covariance matrices. Runs are counted |
|for sequences of length 10,000. This is done ten times. Then|
|another three sets of ten. |
|-------------------------------------------------------------|
The RUNS test for file FourmilabHotBits.32
(Up and down runs in a sequence of 10000 numbers)
Set 1
runs up; ks test for 10 p's: 0.005535
runs down; ks test for 10 p's: 0.144368
Set 2
runs up; ks test for 10 p's: 0.157631
runs down; ks test for 10 p's: 0.668033
|-------------------------------------------------------------|
|This the CRAPS TEST. It plays 200,000 games of craps, counts|
|the number of wins and the number of throws necessary to end |
|each game. The number of wins should be (very close to) a |
|normal with mean 200000p and variance 200000p(1-p), and |
|p=244/495. Throws necessary to complete the game can vary |
|from 1 to infinity, but counts for all>21 are lumped with 21.|
|A chi-square test is made on the no.-of-throws cell counts. |
|Each 32-bit integer from the test file provides the value for|
|the throw of a die, by floating to [0,1), multiplying by 6 |
|and taking 1 plus the integer part of the result. |
|-------------------------------------------------------------|
RESULTS OF CRAPS TEST FOR FourmilabHotBits.32
No. of wins: Observed Expected
98599 98585.858586
z-score= 0.059, pvalue=0.47657
Analysis of Throws-per-Game:
Throws Observed Expected Chisq Sum of (O-E)^2/E
1 66719 66666.7 0.041 0.041
2 37257 37654.3 4.192 4.234
3 27201 26954.7 2.250 6.484
4 19333 19313.5 0.020 6.503
5 13682 13851.4 2.072 8.575
6 10159 9943.5 4.669 13.244
7 7134 7145.0 0.017 13.261
8 5036 5139.1 2.067 15.328
9 3669 3699.9 0.257 15.586
10 2741 2666.3 2.093 17.679
11 1948 1923.3 0.316 17.995
12 1423 1388.7 0.845 18.840
13 1048 1003.7 1.954 20.794
14 720 726.1 0.052 20.846
15 518 525.8 0.117 20.963
16 386 381.2 0.062 21.025
17 281 276.5 0.072 21.097
18 201 200.8 0.000 21.097
19 151 146.0 0.172 21.269
20 104 106.2 0.046 21.315
21 289 287.1 0.012 21.328
Chisq= 21.33 for 20 degrees of freedom, p= 0.37808
SUMMARY of craptest on FourmilabHotBits.32
p-value for no. of wins: 0.476565
p-value for throws/game: 0.378076
_____________________________________________________________
The following results were produced by testing a sequence of 16,779,776 bytes from the HotBits generator with version 1.8 of the U.S. National Institute of Standards and Technology Statistical Test Suite for Random and Pseudorandom Number Generators for Cryptographic Applications as described in NIST Special Publication 800-22 [PDF]. This test suite is supplied as source and executable binaries compiled with Microsoft Visual C++. In testing the program, I encountered numerous crashes due to buffer overflows in editing messages. I corrected these in the source code, rebuilt with Visual C++ .NET, and used my patched version for the tests. Since the executable supplied by NIST crashed on my machine, even running the examples, I had no option but to rebuild it. If you're interested in building your own version that doesn't crash, you can download my patches to the source code.
The data set used in the following tests is identical in the first 11,468,800 bytes to that used in the ENT and Diehard tests above. This is the complete data set I generated for testing; due to the sensitivity of the Diehard tests to the data set size, I limited the data I tested to be the same as that used in the Diehard examples and tested that data set with ENT. The NIST tests seem to have no problems with large data sets, so I used the complete data set in these tests.
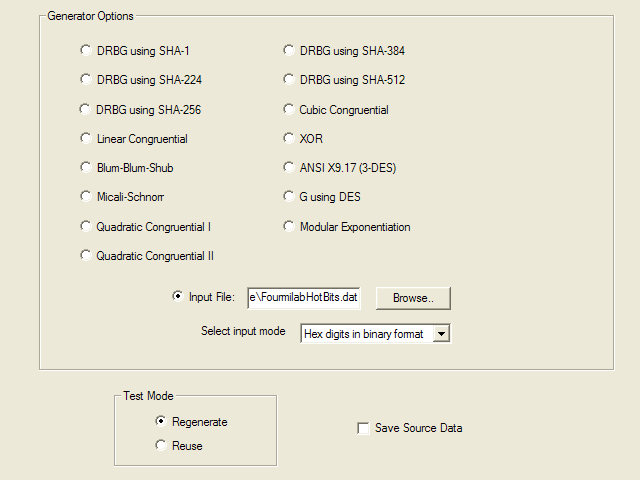
Version 1.8 of the NIST test suite has a rudimentary graphical user interface which runs only under Microsoft Windows. I performed these tests on my development machine, on which I booted Windows XP SP2. The test suite was compiled on a Windows 2000 machine using Microsoft Visual C++ .NET. The first configuration page of the test suite selects the data to be tested. You can choose from a variety of pseudorandom generators, data from a binary file, or a text file containing a sequence of bits represented as ASCII 0 and 1 characters.
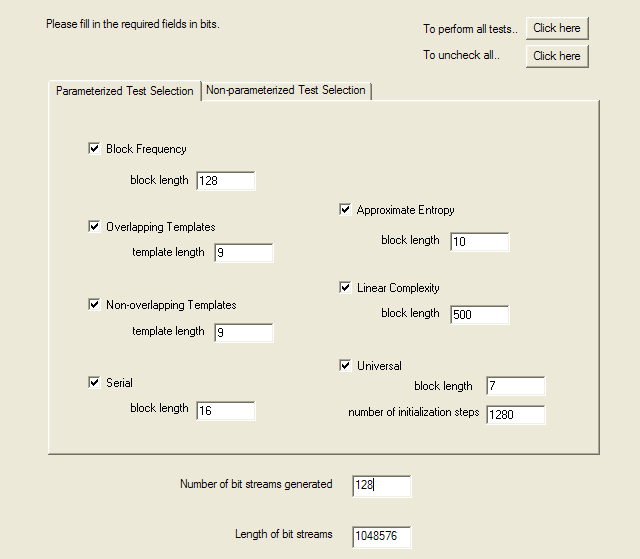
The next page selects the tests to be performed and specifies the parameters to those tests which require them. I enabled all tests and used the parameters from the examples in the paper documenting the tests. Unless you really understand what you're doing, have studied the math underlying the test, and have read the code that implements it, it's a bad idea to get too creative changing these parameters. The LavaRnd people, for example, chose a block length of 14 for the Approximate Entropy test and discovered that with that setting even the “gold standard” Blum-Blum-Shub pseudorandom generator failed this test.
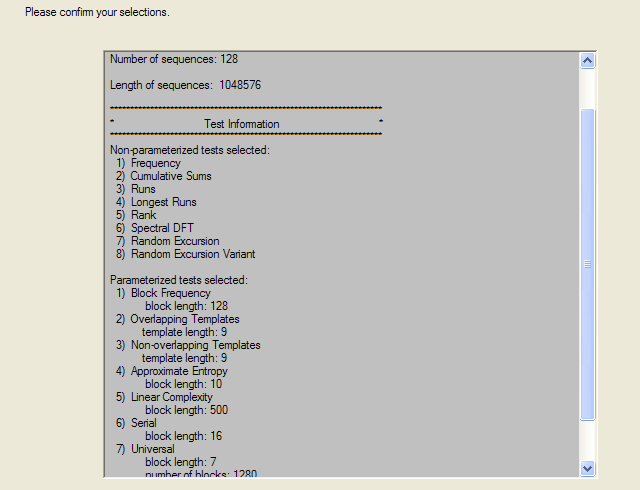
The tests selected and parameters are then displayed on confirmation page, and if accepted the tests begin. On my 3.4 GHz Pentium 4 machine, they run for a couple of hours.
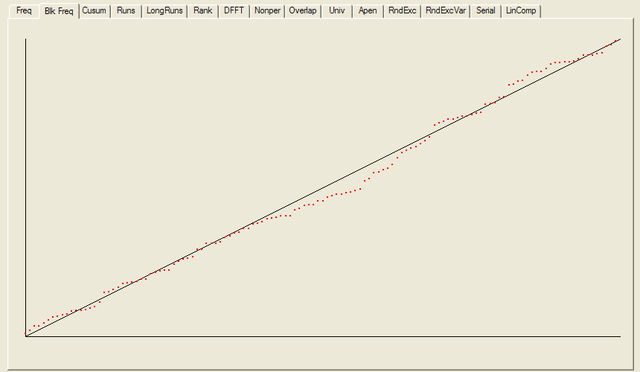
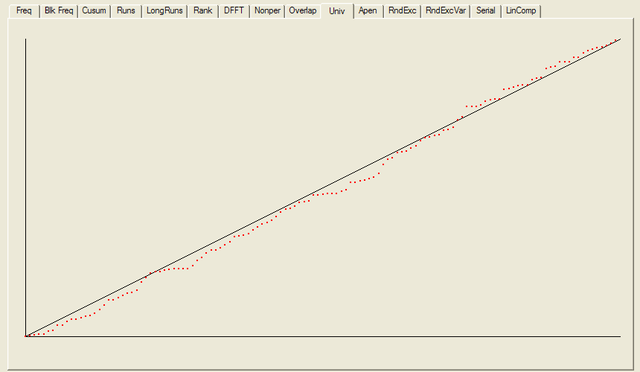
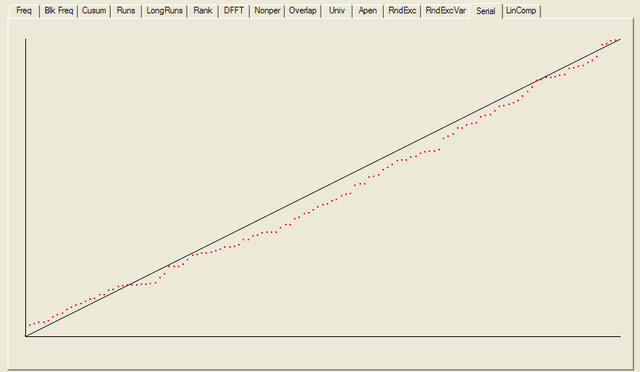
After all the tests have completed, a summary report is written, which is reproduced below. The key values to look at for each test are the “P-value”: the probability the results obtained were due to chance, and the “Proportion” of sequences generated which were deemed to pass the test. Extremal P-values (very close to zero or one), and Proportions which are significantly less than one are indicative of potential problems
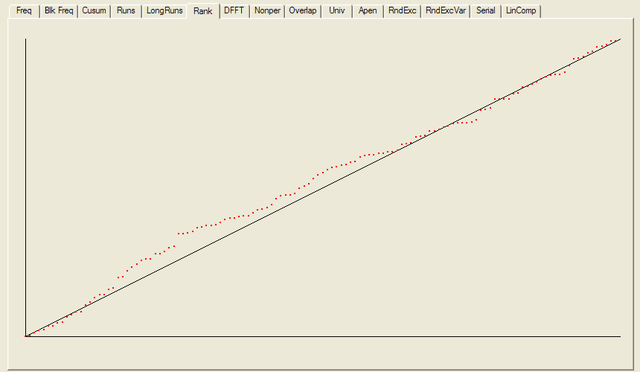
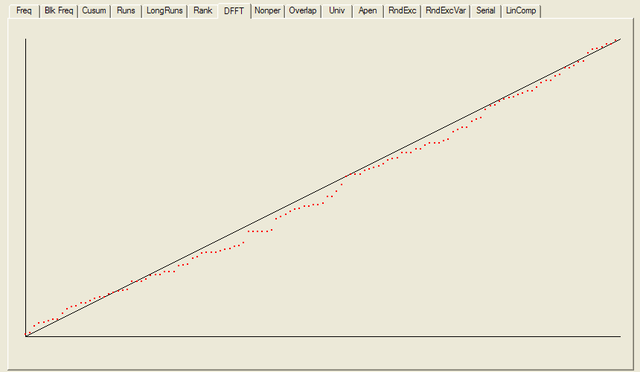
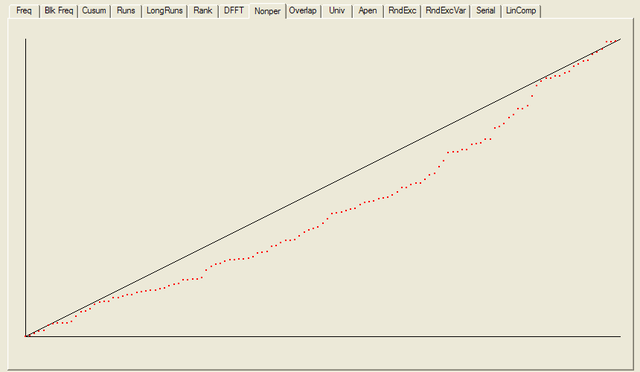
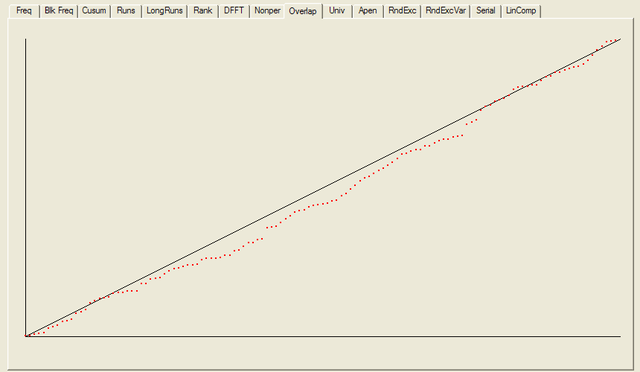
------------------------------------------------------------------------------
RESULTS FOR THE UNIFORMITY OF P-VALUES AND THE PROPORTION OF PASSING SEQUENCES
------------------------------------------------------------------------------

------------------------------------------------------------------------------
 C1  C2  C3  C4  C5  C6  C7  C8  C9 C10  P-VALUE  PROPORTION  STATISTICAL TEST
------------------------------------------------------------------------------
 15  15  14  16   9  10   8  10   9  22  0.090936   0.9766    frequency
 15  12  12  15  19   7   8  14  10  16  0.275709   1.0000    block-frequency
 14  16  17  14   8  11  17   6  10  15  0.232760   0.9766    cumulative-sums
 15  17  15  17  11   6  20   7   8  12  0.041438   0.9766    cumulative-sums
 28  17   8  16   9   8  11  12  10   9  0.000569   0.9609    runs
 14  13  12  13   6  14  16  17   8  15  0.407091   1.0000    longest-run
 13   8  11  14  14  12  18  15  12  11  0.739918   0.9844    rank
 10  17  18  10  13  12  14  10  12  12  0.689019   0.9922    fft
 15  24  14  13  15  10  10   8   9  10  0.048716   0.9844    nonperiodic-templates
 15  12  17   6  12  13  14  15  12  12  0.637119   0.9766    nonperiodic-templates
 15  11  15  12  15  15   9  11  11  14  0.888137   0.9922    nonperiodic-templates
  4   7  14  14  10  15  13  12  23  16  0.014216   1.0000    nonperiodic-templates
 17  13  13   7  10  11  17  15  11  14  0.534146   0.9922    nonperiodic-templates
 14  14  10  17  16   9  13  11   9  15  0.654467   0.9922    nonperiodic-templates
  8  11  21   9   7  10  13  15  18  16  0.057146   1.0000    nonperiodic-templates
 12  12  16  14  15  14  14  10   8  13  0.848588   0.9922    nonperiodic-templates
 10  15  10  10  15  18  16   9  15  10  0.468595   0.9844    nonperiodic-templates
 14  16  13  10  18  11   7  16   7  16  0.213309   0.9844    nonperiodic-templates
 17  16  15  12   8   9  14  11  11  15  0.585209   0.9922    nonperiodic-templates
  9  15   9   8   7  13  19  11  17  20  0.043745   1.0000    nonperiodic-templates
 13  11  11  12  13  13  10  17  14  14  0.941144   1.0000    nonperiodic-templates
 14  15  11  13  14  11  10  14  13  13  0.980883   0.9922    nonperiodic-templates
 10  15  12   6  10  18  12  17  16  12  0.287306   1.0000    nonperiodic-templates
 20  14  10   8  15  10  11  11  11  18  0.232760   0.9766    nonperiodic-templates
 15  10  17   9  14  15  13  15   9  11  0.671779   0.9844    nonperiodic-templates
 12  13  12  11  14  14  13  15  15   9  0.957319   0.9844    nonperiodic-templates
 10  15  15  12  14   8  13  15  13  13  0.875539   0.9766    nonperiodic-templates
 14  10  17  15   7  16   8  11  14  16  0.350485   0.9844    nonperiodic-templates
 20  12  10   9  14  14  18  11  12   8  0.242986   0.9609    nonperiodic-templates
 14  11  15   9  14  17   9  14   9  16  0.585209   0.9766    nonperiodic-templates
 17  18  11   9  10  12  11   6  13  21  0.063482   0.9922    nonperiodic-templates
 13  10   9  15  15  21   8   7  18  12  0.070445   1.0000    nonperiodic-templates
 11   8  18  15  10   6  11  18  15  16  0.134686   1.0000    nonperiodic-templates
 15  14  17  12   9  12   9  10  14  16  0.671779   0.9766    nonperiodic-templates
 17  10  18  11  16  10  10  11   9  16  0.378138   0.9844    nonperiodic-templates
 15  12  15  14  17  12   8   9  12  14  0.706149   1.0000    nonperiodic-templates
 12  10  14  12  14   8  16  13  12  17  0.756476   0.9922    nonperiodic-templates
 13  11  15  13   8  15  10  12  12  19  0.585209   1.0000    nonperiodic-templates
 13  14  14  16  11  12  16  10  11  11  0.911413   0.9766    nonperiodic-templates
 14  12  14  11   7  13  18  11  16  12  0.602458   0.9922    nonperiodic-templates
 13  11  12  15   7  11  11  16  17  15  0.602458   0.9688    nonperiodic-templates
 14   6  12  16  16  14  15  13  12  10  0.585209   1.0000    nonperiodic-templates
 12   9  10  10  14  14  15  10  15  19  0.534146   1.0000    nonperiodic-templates
  6  15  11  17  19  14  11  10  13  12  0.287306   0.9922    nonperiodic-templates
 12  16   9  13  13  14  11  11  13  16  0.900104   1.0000    nonperiodic-templates
  8  10  14  10  15   8  17  25  13   8  0.008879   0.9922    nonperiodic-templates
  9   6  25   8  19   8  14  12  15  12  0.002316   0.9844    nonperiodic-templates
 16  11  13  14  14  14   9   7  17  13  0.585209   0.9844    nonperiodic-templates
 16  10  13  15   7  14  14  13   8  18  0.378138   0.9844    nonperiodic-templates
 10  19  14  13  12  11  12  13   7  17  0.422034   0.9922    nonperiodic-templates
 17  10   9  13  11  10  13  14  16  15  0.723129   1.0000    nonperiodic-templates
 13  10  12  19  13  20   9   9  12  11  0.242986   0.9922    nonperiodic-templates
  6  18  11  11  11  11  17  19  12  12  0.186566   1.0000    nonperiodic-templates
 12  12  18  14   9  11  15  15   8  14  0.602458   0.9922    nonperiodic-templates
 23  10  12  10  12  12  11  17   8  13  0.110952   0.9766    nonperiodic-templates
 13  15  11  15   7  15   9  12  24   7  0.022503   0.9766    nonperiodic-templates
  8   8  13  17  16  10  15   9  18  14  0.253551   0.9922    nonperiodic-templates
  8  10  10  13  11  18  10  18  17  13  0.299251   1.0000    nonperiodic-templates
 13  10  13  15  13  10  14  17   9  14  0.819544   0.9922    nonperiodic-templates
 18  11   7  12  12  14  14  17  10  13  0.500934   0.9766    nonperiodic-templates
 16  16  14  11  16   8  12  14  11  10  0.689019   0.9844    nonperiodic-templates
 11  19  14  14  14  15   9   7  15  10  0.364146   0.9922    nonperiodic-templates
 18  15  13  14   6  10  16  16  12   8  0.242986   0.9922    nonperiodic-templates
 11  15  13  14  17  17   7  12  12  10  0.551026   1.0000    nonperiodic-templates
 12  17  11  14  17  12   7  12  14  12  0.637119   0.9844    nonperiodic-templates
  9  13  13   5  10  12  15  20  12  19  0.078086   0.9922    nonperiodic-templates
 11  11  11  17  18  16  15   6   9  14  0.242986   1.0000    nonperiodic-templates
 14  13   8  15  10  15   9  14  13  17  0.654467   0.9922    nonperiodic-templates
 18   7  12  15   7  16  15  13  10  15  0.264458   0.9844    nonperiodic-templates
  3  13  15  17  13  16  20   5  17   9  0.005490   1.0000    nonperiodic-templates
 10  16  15  13  10  19  13   8  12  12  0.500934   0.9844    nonperiodic-templates
 16  16  10  12   7  12   7  16  14  18  0.222869   0.9844    nonperiodic-templates
 12   6  15  20  17  12   7  16  11  12  0.100508   0.9844    nonperiodic-templates
 12  15  10  14  12  15  14  14  13   9  0.931952   0.9766    nonperiodic-templates
  6  10  11  17  14  12  13  11  20  14  0.232760   0.9922    nonperiodic-templates
 11  20  13   9  16   8  13  11  10  17  0.242986   1.0000    nonperiodic-templates
 18   8   5  12  17  16  18   9  15  10  0.054199   1.0000    nonperiodic-templates
 11  13  10  17  14   7  15  14  15  12  0.654467   0.9922    nonperiodic-templates
 14  10   9  13   9   8  20  17  14  14  0.232760   0.9766    nonperiodic-templates
 12  10  16  10  11  12  14  12  12  19  0.689019   0.9844    nonperiodic-templates
 10  13  13  12  16  12  15  10  11  16  0.888137   0.9844    nonperiodic-templates
 13  10  14  14  18  17  12  12   6  12  0.422034   0.9922    nonperiodic-templates
 15  24  14  13  15  10  10   8   9  10  0.048716   0.9844    nonperiodic-templates
 14  10  13  16  11  15  11   6  15  17  0.452799   0.9766    nonperiodic-templates
  8  14   9  13   8  14  21  13  13  15  0.222869   1.0000    nonperiodic-templates
 17  16   9  14  11  11  14  10  12  14  0.772760   0.9688    nonperiodic-templates
 11  12  11  10  14  11  15  19  15  10  0.654467   1.0000    nonperiodic-templates
 19   7   8  12  11  14  20  11  13  13  0.141256   0.9844    nonperiodic-templates
 12  15  19  15   8   8  13  12  18   8  0.178278   0.9844    nonperiodic-templates
  8  16  11  13  13   9  15  20  10  13  0.337162   0.9922    nonperiodic-templates
  9   8  15  15   8  17  16  17   9  14  0.242986   0.9922    nonperiodic-templates
 18  12   6  12  12   9  13  24  12  10  0.023812   0.9922    nonperiodic-templates
  6  11  11  15  10  17  11  21  18   8  0.041438   0.9922    nonperiodic-templates
  7  13  14  14  12  14   4  16  18  16  0.116519   1.0000    nonperiodic-templates
 11   9  17  11  14  13  13  14  13  13  0.911413   1.0000    nonperiodic-templates
 15   9  11  16  15   5  19  13  12  13  0.213309   0.9688    nonperiodic-templates
 13  18   8  12  11   8  14  18  14  12  0.392456   0.9766    nonperiodic-templates
 17  11  16  10  13  14   9  14  12  12  0.804337   0.9844    nonperiodic-templates
 15  16  11   8  12  14  13  18   6  15  0.299251   0.9766    nonperiodic-templates
 12  10   9  13  17  10  14  12  18  13  0.637119   0.9844    nonperiodic-templates
 11  12  17  12  11  11  14  16   9  15  0.788728   0.9844    nonperiodic-templates
  7  14  17  13  10  14  14  13  14  12  0.739918   0.9922    nonperiodic-templates
 19  13  14  10  14  12  18  12   9   7  0.275709   0.9766    nonperiodic-templates
 16   8   8  13   9  15  18  14  14  13  0.407091   0.9844    nonperiodic-templates
 10  14  15  12   9  12  12  12  20  12  0.585209   0.9844    nonperiodic-templates
 11  10  11  22   8  15  10  16  14  11  0.162606   0.9922    nonperiodic-templates
 13  18  11   9  16  16  15   8  12  10  0.437274   0.9922    nonperiodic-templates
 17  10  10  11   8  18  11  13  13  17  0.392456   0.9922    nonperiodic-templates
 11  15  14  12  17   8  13  13  17   8  0.517442   1.0000    nonperiodic-templates
 15   8  13  10   9  13  12  15  21  12  0.287306   1.0000    nonperiodic-templates
  9   8   9  20  17  12   7  15  17  14  0.078086   0.9922    nonperiodic-templates
 16  15  13  10  12  15  10   8  17  12  0.637119   0.9766    nonperiodic-templates
  6  11  10  16  12  15  17  11  15  15  0.422034   0.9844    nonperiodic-templates
 11  16   6  13  15   5  15  17  16  14  0.128379   1.0000    nonperiodic-templates
 14  10  16  12   9   9  10  17  18  13  0.437274   0.9766    nonperiodic-templates
 12  12  11   9  18  18  12  10  12  14  0.585209   0.9844    nonperiodic-templates
 12  12  14  16  12  12  11  21   7  11  0.299251   0.9922    nonperiodic-templates
 15  16  12   8  15  14  10  11  18   9  0.468595   1.0000    nonperiodic-templates
 11  17  18  12  17   7   9  14  12  11  0.311542   1.0000    nonperiodic-templates
 20  16  12  11  17  10  13  12   8   9  0.253551   0.9844    nonperiodic-templates
 10  14  17  10  13   7  15  15   8  19  0.204076   1.0000    nonperiodic-templates
 14  17  14   8  15  13  11   9  14  13  0.723129   0.9922    nonperiodic-templates
 11  15  16  16  11  11  19  10  11   8  0.392456   0.9766    nonperiodic-templates
 16  10  16   7   9  17  10  13  13  17  0.311542   0.9844    nonperiodic-templates
 12  17  14  10  17   9  12  11  11  15  0.689019   0.9844    nonperiodic-templates
  9  11  14  18   9  17  14  17  10   9  0.311542   0.9766    nonperiodic-templates
  8  16  15   7  11  10  11  15  15  20  0.170294   1.0000    nonperiodic-templates
 16  11  13  14   3  16  15  12  12  16  0.213309   0.9766    nonperiodic-templates
 12  22  11  15  12   9  19  11   7  10  0.057146   1.0000    nonperiodic-templates
 14  17   7  13   7  13  17  18   9  13  0.178278   0.9922    nonperiodic-templates
 14  12  10  15  12  12  14  10  13  16  0.941144   1.0000    nonperiodic-templates
 12  14  10  16   9  10  17  12  12  16  0.689019   1.0000    nonperiodic-templates
 14  10  11   9  20  10  10  19  12  13  0.232760   1.0000    nonperiodic-templates
 12  15  17   9  11  11  12  12  17  12  0.756476   0.9844    nonperiodic-templates
 12  16  19  13  11  14   9  15  12   7  0.392456   0.9922    nonperiodic-templates
 16  10  11  13  11  11  16  20  10  10  0.407091   1.0000    nonperiodic-templates
 17   8  19  12  13  16   8  13  12  10  0.299251   0.9922    nonperiodic-templates
 15  15  12  12  16   9  19  14   4  12  0.148094   0.9922    nonperiodic-templates
 15  14  11  10  10  21   7  13  13  14  0.264458   0.9922    nonperiodic-templates
 16  16  13  14  13  10  10   9  18   9  0.500934   0.9844    nonperiodic-templates
 19   5  16  13  14   6  13  14  16  12  0.100508   0.9922    nonperiodic-templates
 13  13  17  11  13  12  11  14  12  12  0.970538   1.0000    nonperiodic-templates
 16  13   8  12   9  15  18  13  15   9  0.452799   1.0000    nonperiodic-templates
 14  13  11   9  19  14  10  12  10  16  0.568055   1.0000    nonperiodic-templates
 10  13  18  12  20  13  13  10  10   9  0.324180   1.0000    nonperiodic-templates
  9  18   9  12  13  12  13  14  12  16  0.706149   1.0000    nonperiodic-templates
 11  15  12  13  14  11  18  11  14   9  0.788728   0.9922    nonperiodic-templates
 11  19  12  14  10  10  17  14  10  11  0.534146   1.0000    nonperiodic-templates
  9  14  12   9  18   8  13  13  15  17  0.422034   1.0000    nonperiodic-templates
 11  13   8  13  17   8  12  18  18  10  0.253551   0.9922    nonperiodic-templates
 10  15  17  16   8  18  12   5  11  16  0.110952   0.9922    nonperiodic-templates
  7  14  11  10  10  25  16  11  14  10  0.022503   0.9922    nonperiodic-templates
  7  18  12  14   8  10  15  18  11  15  0.232760   1.0000    nonperiodic-templates
 16  17  11  16  11  14  15  12   8   8  0.468595   0.9844    nonperiodic-templates
 12  11  14  13  12  13   5  20  14  14  0.299251   0.9688    nonperiodic-templates
 13  10  15  13  18  17  12  12   6  12  0.407091   0.9922    nonperiodic-templates
 14  16  17  10  14  10  14   8  14  11  0.654467   0.9766    overlapping-templates
 17  10  16  11  16   9  13  11   9  16  0.517442   0.9609    universal
 17  12  10  18  11  12  13  11  11  13  0.756476   1.0000    apen
  7   5  10   9  11   9   7   8   7   8  0.947557   1.0000    random-excursions
  7  13   5   5   6  12   4  10  11   8  0.235285   0.9877    random-excursions
  3   4   7  14   8   7   9   9   7  13  0.146359   1.0000    random-excursions
 11   6   6   9   8   9   7  10   6   9  0.934318   1.0000    random-excursions
  6   6   9   9   5  10   8   8   8  12  0.845066   1.0000    random-excursions
  7  16   4   6   5   8   8  11  12   4  0.050710   0.9877    random-excursions
 10   6   6   6   8  12  11   7   6   9  0.752361   1.0000    random-excursions
  6  10   7   6  10   7   9  11  10   5  0.823278   1.0000    random-excursions
  7  10   7   7  12   7   7   9   6   9  0.919445   0.9877    random-excursions-variant
  8   5   8  10   7  11   4  13   7   8  0.521600   0.9877    random-excursions-variant
  8   7   7   8   8  11   4   6   9  13  0.624107   0.9877    random-excursions-variant
  8   7   8   9   8  10   4  10  10   7  0.919445   1.0000    random-excursions-variant
  7  10   7   6   7   5  11  13   7   8  0.650132   1.0000    random-excursions-variant
  7   5  12   9  11   5   3   7   7  15  0.087559   1.0000    random-excursions-variant
  7   8   5  13   8   7  10  11   5   7  0.598138   1.0000    random-excursions-variant
  5   8   7   8   6  14  11   5   8   9  0.472584   0.9753    random-excursions-variant
  5   6   9  10   6   9  11   9   8   8  0.902994   0.9753    random-excursions-variant
  6   7  11   9   9   8   7   6  10   8  0.959132   0.9877    random-excursions-variant
  5   8  14  10   9   7   5  12   4   7  0.235285   1.0000    random-excursions-variant
  9  10   7  10   6   6   9   8   8   8  0.984058   0.9877    random-excursions-variant
 12   6   3  17   7   3   6   9   7  11  0.013217   0.9877    random-excursions-variant
 11   5   6   7  14   7  11   7   5   8  0.360699   0.9753    random-excursions-variant
  5   9   8  10   9   8   3   8  13   8  0.521600   0.9630    random-excursions-variant
  5   8   8  10  13   3   7  11   8   8  0.425817   0.9753    random-excursions-variant
  5   7  13   9  11   6  10   8   9   3  0.360699   0.9877    random-excursions-variant
  5  10  10   7  13   9   8   2  10   7  0.302291   0.9877    random-excursions-variant
 11  19  13  16  12  12  10  14  10  11  0.671779   0.9922    serial
 17  10   9  14  12  21  17  11   7  10  0.095617   0.9922    serial
 15  10  13  12  12  14  11  18   8  15  0.671779   0.9922    linear-complexity


- - - - - - - - - - - - - - - - - - - - - - - - - - - -- - - - - - - - - - - - -
The minimum pass rate for each statistical test with the exception of the random
excursion (variant) test is approximately = 0.963616 for a sample size = 128
binary sequences.

The minimum pass rate for the random excursion (variant) test is approximately
0.956834 for a sample size = 81 binary sequences.

For further guidelines construct a probability table using the MAPLE program
provided in the addendum section of the documentation.
- - - - - - - - - - - - - - - - - - - - - - - - - - - -- - - - - - - - - - - - -
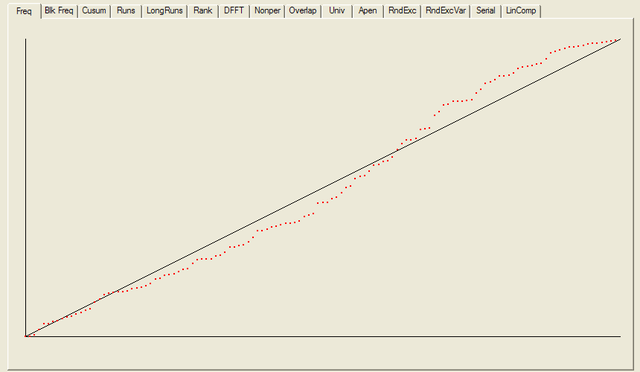
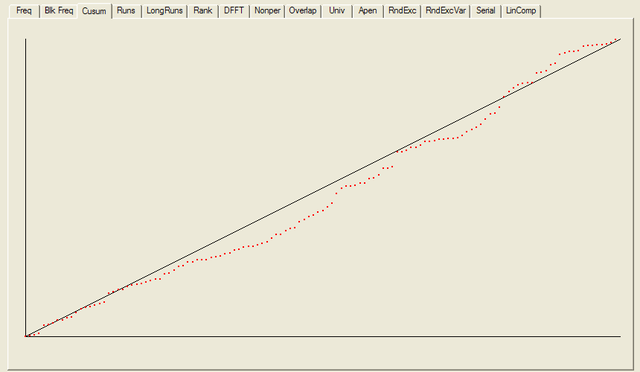
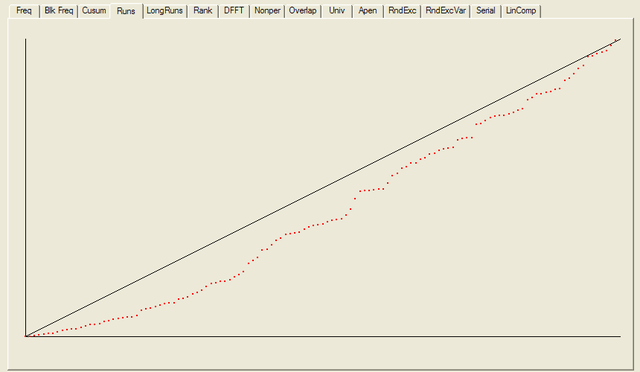
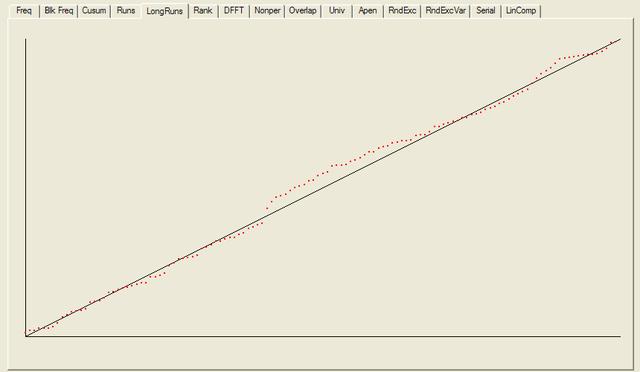
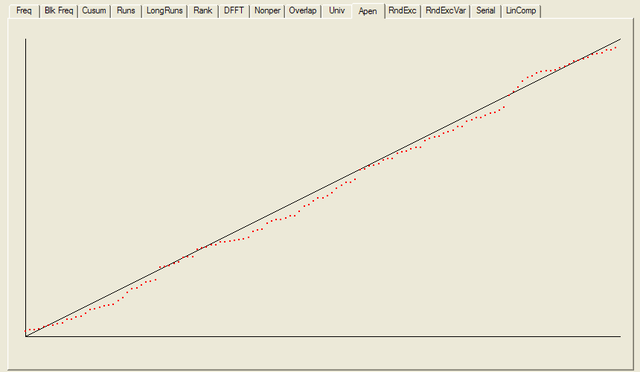
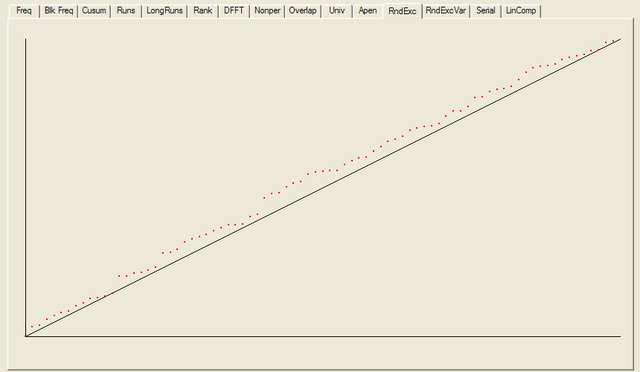
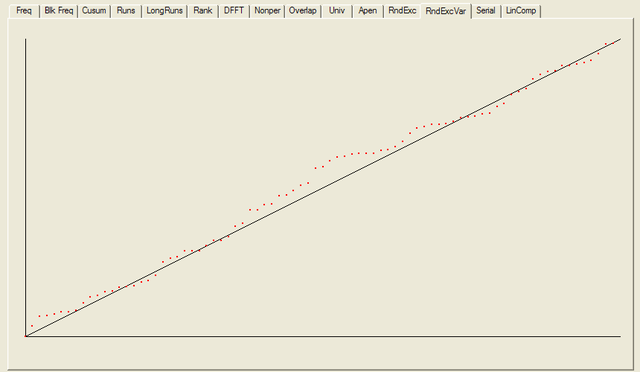
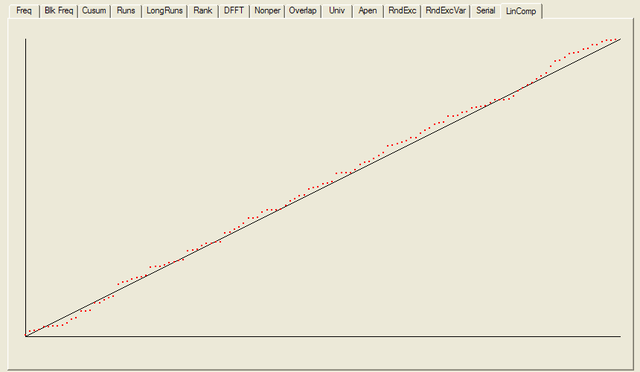
For each test a chart is generated which shows the expectation for a random sequence as a solid line with the results from the data being tested plotted as a series of red dots for each sub-sequence tested. The following are the charts for the HotBits data.
In addition to the test summary and graphs, detailed results from the various tests are written to a number of data files. You can download a ZIPped archive containing all of these results, and the HotBits data stream which was tested to produce them from the links below.
Each HotBits generator machine performs a continuous quality control check on the random data it produces. For each block of random data generated, a specified percentage (10% for the Fourmilab generators) of additional data is generated and subjected to the ENT tests described above. The results of these tests, both for all bytes produced since the HotBits generator was started and those generated since the last status report was requested, are reported in the server status report as shown below. This status report is available only on the Fourmilab local network—it is not accessible over the Internet.
Quality control testing is performed on bytes generated expressly for that purpose and discarded immediately after being tested. The random bytes produced for inventory and returned to requesters have not been examined by any program or human before being delivered.
Server hotbits0.dmz.fourmilab.ch up since Monday, 25 September 2006 15:12:14 CEST
Inventory loaded from file: 7647232
Requests processed: 10006, 10001 OK, 5 rejected
Unauthorised access attempts: 0
Bytes returned: 10239757
Inventory length: 7103488
Inventory file (/server/var/hbproxy/inventory.dat) length: 7103488, valid.
Bytes in current buffer: 243
Bytes built for inventory: 9696256
Seconds spent building inventory: 92926,
104 bytes/second
Quota queue length: 0
Quality measurements on a sample of 965838 bytes generated
since the server was started:
Entropy: 7.999825 bits per byte.
Chi-square distribution: 233.74 (random exceeds this 75.00% of the time).
Mean value: 127.5374 (expectation: 127.5).
Monte Carlo π value: 3.141470930 (error 0.00 percent).
Serial correlation coefficient: 0.000885 (expectation 0).
Quality measurements on a sample of 159018 bytes generated
since Friday, 29 September 2006 13:39:55 CEST:
Entropy: 7.998742 bits per byte.
Chi-square distribution: 277.54 (random exceeds this 25.00% of the time).
Mean value: 127.8514 (expectation: 127.5).
Monte Carlo π value: 3.138663548 (error 0.09 percent).
Serial correlation coefficient: 0.002713 (expectation 0).
Release 3.0, September 2006
Built on Sep 25 2006 at 15:12:09
|
|