Retropsychokinesis is the claimed ability of certain subjects to alter random data generated, but not examined, prior to the time the data are presented to the subject. Crazy, you say! Well, there's certainly no mechanism in mainstream physics which could permit such an effect, yet experiments conducted by a number of different researchers over the last 20 years suggest, compellingly according to some analyses, that the probability of the results obtained in such experiments being purely the result of chance is sufficiently low that they would be considered evidence of a causal mechanism in most scientific disciplines.
We neither accept nor dismiss the existence of retropsychokinetic effects—instead we make experiments available to anybody with access to the World-Wide Web in order to discover if there is anything genuinely there. If so, the implications for physics and consciousness studies are profound. That's reason enough to see if there's something spooky going on or just a blip readily explained by the inevitability of improbable results in a few of an immense number of experiments.
To explore the history of retropsychokinesis and the development of the experiments performed at this site, please visit the Background document. All documents related to these experiments can be found from the Table of Contents.
A variety of feedback programs translate the stream of random bits from the generator into various graphical representations which allow you to see the extent to which the bit stream is departing from the most probable result of an equal number of ones and zeroes. The feedback programs are HTML5 animations; to run them, your Web browser must support the HTML5 standard (most modern browsers do). The feedback programs are also available as Java™ applets; you can select them from the Java experiments page.
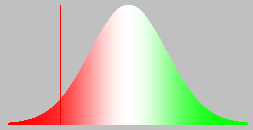
The bell curve feedback program provides direct feedback of the
extent to which the random bit stream diverges from the most
probable expectation of an equal number of zeroes and ones. The bell
curve represents the binomial distribution which governs
sequences of random events. The vertical bar starts in the centre
of the distribution and moves to the right every time a one bit
occurs and to the left for every zero bit. The height of the curve
shows the extent to which the deviation, if any, from equal numbers
of ones and zeroes differs from the chance expectation. Your goal
is to attempt to influence the pointer to move to the right or left,
toward the low-probability “tail” of the curve. If the pointer runs
off the edge of the window, the bell curve graph is scrolled so that
the pointer remains visible.
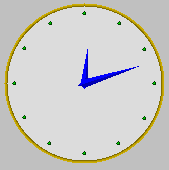
The clock face provides a familiar form of feedback which allows you to
concentrate on the process rather than the probability. Every one bit
from the random bit stream causes the minute hand to advance clockwise
by one minute, and each zero bit moves it back one minute. The hour
hand provides feedback of cumulative results if the minute hand wraps
one or more time around the dial. The hands are shown in blue if
the number of one bits exceeds the number of zeroes, and red if
zero bits predominate.
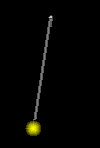
The pendulum provides an indirect form of feedback, which results in a
less jittery animation, while continuing to reflect the contents of the
bit stream from the generator. The pendulum swings smoothly from side
to side (assuming your computer is fast enough to run the simulation
and not tied up running other programs), while the width of
the swing is governed by the bits from the random generator. Each one
bit makes the pendulum's swing wider; each zero bit makes it narrower.
You attempt to either drive the swing as wide as possible (so the bob
hits the side of the window), or reduce it so the bob comes to a
complete stop.
Each experimental run (except “Demo” runs which do not use live data from the random number generator) is logged. You can retrieve the log in either raw (an ASCII comma-separated-value text file) form, or as a Web document which presents information from the log in a tabular form and calculates statistics from the raw data. You can retrieve just your own runs or those of all subjects who have participated in the experiments. To display the log, fill out the Log Report Request Form and submit it to receive a log report prepared according to the specifications you indicated on the form.
 RetroPsychoKinesis Project Home