« Reading List: The Day the Dollar Died | Main | Reading List: After America »
Thursday, August 18, 2011
Gnome-o-gram: Parkinson's Law and the U.S. Public Debt
I've long been interested in long-term exponential growth curves, and when I happened across a chart of the U.S. statutory debt limit (which was much in the news recently, due to the stand-off over the most recent increase), I couldn't help noticing just how exponential it looked. So, I decided to see how well the actual U.S. public debt (the actual debt, not the limit) fit a model of exponential growth and, if so, what the compounded rate of growth was. Bottom line: it's pretty much exponential, with a growth rate from 1950 through 2010 of around 6.8% per annum. Here's a chart of my hand-fit to the data series: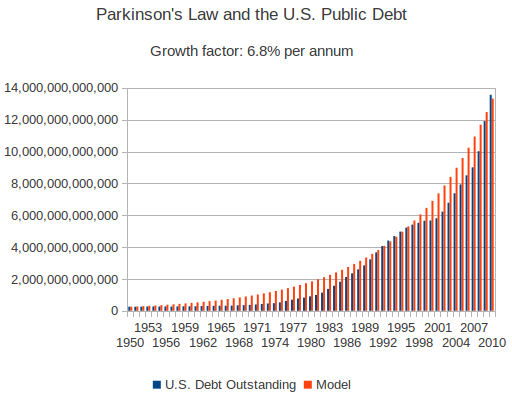 I made this fit simply by adjusting the exponent until the growth from 1950 approximated the figure for 2010, and was amazed how close the fit was. I didn't do any fancy least squares regression—if you'd like to fiddle with the data yourself, you're welcome to download the LibreOffice spreadsheet I used to prepare this chart. The data are from the U.S. Treasury Bureau of the Public Debt.
What is fascinating about this is that Parkinson's Law, albeit having been variously formulated since its first statement in 1955, predicts that the staff within a bureaucracy will expand at a rate between 5 and 7 percent per year, “irrespective of any variation in the amount of work (if any) to be done.” Isn't it interesting that government debt falls precisely within this range? Now, aggregate public debt in depreciating nominal dollars is a very different kind of statistic than an easily-quantified metric like headcount, but reality has a way of going all Pareto on you, and I wouldn't be startled in the least to discover a similar exponential growth fit with a comparable exponent to many other socio-economic time series. You may find a better exponential fit to the debt if you start with 1971, when Nixon closed the gold window.
Gentlemen (and ladies), start your (analytical) engines!
Update: On further reflection, I wondered what this chart might look like if I displayed the debt in inflation-adjusted constant dollars instead of depreciating nominal dollars. In the chart below, the blue debt bars have been adjusted to 2010 dollars according to the average Consumer Price Index (CPI) for each year. (Yes, I am fully aware that the CPI is increasingly bogus, but you have to use something, and this is a statistic which is widely used and well understood.)
I made this fit simply by adjusting the exponent until the growth from 1950 approximated the figure for 2010, and was amazed how close the fit was. I didn't do any fancy least squares regression—if you'd like to fiddle with the data yourself, you're welcome to download the LibreOffice spreadsheet I used to prepare this chart. The data are from the U.S. Treasury Bureau of the Public Debt.
What is fascinating about this is that Parkinson's Law, albeit having been variously formulated since its first statement in 1955, predicts that the staff within a bureaucracy will expand at a rate between 5 and 7 percent per year, “irrespective of any variation in the amount of work (if any) to be done.” Isn't it interesting that government debt falls precisely within this range? Now, aggregate public debt in depreciating nominal dollars is a very different kind of statistic than an easily-quantified metric like headcount, but reality has a way of going all Pareto on you, and I wouldn't be startled in the least to discover a similar exponential growth fit with a comparable exponent to many other socio-economic time series. You may find a better exponential fit to the debt if you start with 1971, when Nixon closed the gold window.
Gentlemen (and ladies), start your (analytical) engines!
Update: On further reflection, I wondered what this chart might look like if I displayed the debt in inflation-adjusted constant dollars instead of depreciating nominal dollars. In the chart below, the blue debt bars have been adjusted to 2010 dollars according to the average Consumer Price Index (CPI) for each year. (Yes, I am fully aware that the CPI is increasingly bogus, but you have to use something, and this is a statistic which is widely used and well understood.)
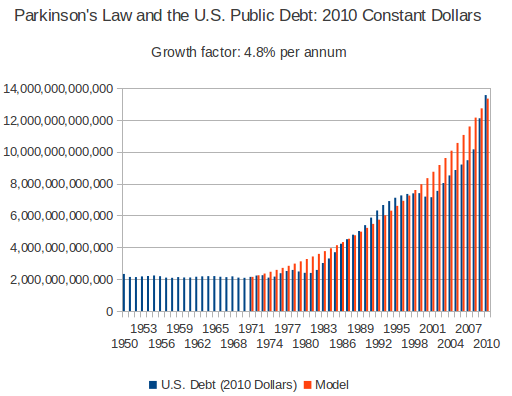 From this perspective, things look quite different: the public debt in 2010 constant dollars barely budged from 1950 until 1971, when Nixon closed the gold window and decoupled the dollar from gold. Without the discipline of gold (before, if the U.S. ran up large deficits and printed money to cover them, foreign central banks could exchange the excess dollars for gold, emptying out the treasury's vault), there was no constraint on the issuance of debt and the creation of dollars and the curve began to climb to the sky, slowly at first and then at an accelerating pace. Here I've fit an exponential to the period from 1971 through 2010, and once again it fits pretty well, with a growth factor of 4.8% per year, just a tad below Parkinson's range of five to seven percent.
If you'd like to explore this further, you can download the spreadsheet from which this chart was produced as well as a spreadsheet of the CPI from 1913 through 2010. (2011-08-19 17:48 UTC)
From this perspective, things look quite different: the public debt in 2010 constant dollars barely budged from 1950 until 1971, when Nixon closed the gold window and decoupled the dollar from gold. Without the discipline of gold (before, if the U.S. ran up large deficits and printed money to cover them, foreign central banks could exchange the excess dollars for gold, emptying out the treasury's vault), there was no constraint on the issuance of debt and the creation of dollars and the curve began to climb to the sky, slowly at first and then at an accelerating pace. Here I've fit an exponential to the period from 1971 through 2010, and once again it fits pretty well, with a growth factor of 4.8% per year, just a tad below Parkinson's range of five to seven percent.
If you'd like to explore this further, you can download the spreadsheet from which this chart was produced as well as a spreadsheet of the CPI from 1913 through 2010. (2011-08-19 17:48 UTC)
Posted at August 18, 2011 22:29