« SpaceX Inspiration4 Launch Replay | Main | A Bolt from the Blunderers »
Thursday, September 16, 2021
THE HAPPENING WORLD: U.S. Federal Reserve Flexible Consumer Price Index Remains in Record Territory
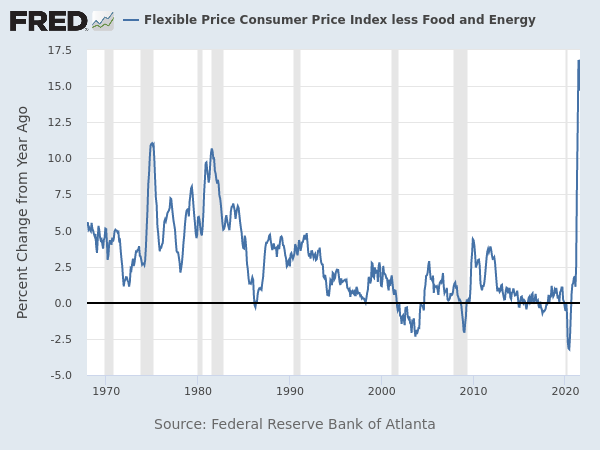
Ever since December 1967, the U.S. Federal Reserve Bank of Atlanta has published a monthly report called the “Sticky-Price Consumer Price Index (CPI)”. The complete time series may be consulted at the St. Louis Federal Reserve's FRED site as data set COREFLEXCPIM159SFRBATL. This index is composed of a weighted basket of goods whose prices have, historically, changed relatively rapidly, and excludes the core items of food and energy. It has, over time, given a snapshot of “sticker price” inflation as perceived by the general populace.
Over its history, the index has mostly meandered in a random walk between 0 and 5 percent annual price change, with two large spikes in the vicinity of 10% in early 1975 and 1980–1981. That's before the index for April 2021 (reported around the middle of the following month, as always), which jumped in one month from 2.5% annualised in March to 8.2% for April. In May, it hit an all-time high since its inception in 1967 of 12%, then in June rocketed to another record of 16.7% and rose slightly to 16.76% in July. The August figures have just been published, and show a decline to 14.7%, which is still around 50% higher than at any time in the half century preceding 2021.
Now, monetary inflation doesn't act all at once or uniformly across an economy. It usually first causes rapid price appreciation in volatile financial markets which tends to feed on itself as a bubble mentality develops (check!), then some time later begins to show up in flexible prices such as tracked by the present index. Only later do “sticky” prices begin to budge, and finally the circle closes as workers demand pay increases to cope with the rising cost of living, which feeds back into cost of goods and accelerates price increases. All of this is generally accompanied by phenomena such as “labour shortages”, “supply chain disruptions”, “a tight housing market”, and other distractions cited by the perpetrators to shift blame from the actual cause, which is profligate money printing uncoupled from the supply of goods in the market.
In any case, here we have another of what what I call a “Year of the Jackpot” chart, showing something happening which has never before occurred during the lifetimes of a majority of living humans. It is not unreasonable to infer that such indicators might portend consequences which are equally outliers to conventional wisdom expectations.
Posted at September 16, 2021 13:44