« Reading List: Billion Dollar Whale | Main | Reading List: The Voyage of the Iron Dragon »
Tuesday, June 25, 2019
Gnome-o-gram: Inverted Yield Curve
The yield curve is a measure of the sentiment of investors, particularly conservative investors who own fixed-income securities (bonds and equivalents). (Much of the financial press covers the equity [stock] markets and neglects the bond markets, but the bond markets dwarf the stock market in valuation. Bonds aren't [usually] exciting [and when they are things are generally unpleasant], so they don't get much attention, but if you're interested in the flow of funds [and you should be], that's where you ought to be looking.) The yield curve simply plots, for equivalent fixed-income (debt) securities (bonds), the relationship between the yield of the security and the time to its maturity (when the investor gets his or her money back). For example, consider the most widely traded securities in the world: U.S. Treasury debt. These instruments have various names: Treasury Bills, Treasury Notes, and Treasury Bonds, depending upon their time to maturity, but they all are obligations of the U.S. Treasury and bear the full faith and credit of the United States. They are considered as close to risk-free as any paper investment in the world.
In normal financial circumstances, which is almost all the time, the longer the time to maturity of the investment, the greater the yield. For example, in May 2018, a 90 day U.S. Treasury Bill yielded around 1.6% interest (per annum, as will be all figures quoted). If you were willing to lock in your money for a year, you'd get about 2.25%. Go out five years in a Treasury Note and that would go up to around 2.8%, and with a ten year commitment you'd get 3%. Longer terms would get higher yields, but it's asymptotic—at thirty years in a Treasury Bond you'd only get 3.2%.
Although nothing in investing can be considered normal since 2008, and yield curves in the era of sound money and before artificial repression of interest rates were more linear, the slope of this curve is representative of normal conditions. An investor who locks up their money for a longer term at a fixed rate of return is assuming the risk that they may be repaid in inflated money worth less than that they used to purchase the bond, or that they may forgo more attractive investment opportunities during the time their money is locked up in the bond. (You can always sell a bond before its maturity, but if interest rates have risen since the time you bought it, you'll take a loss compared to what you paid as the purchaser will discount the price so the bond yields a market rate of return.) Therefore, they usually demand a “risk premium” in the form of a higher interest rate on the investment to compensate for these risks. There is always some rate at which investors judge worth tying up their money for a longer time. The greater the perception of risk, the steeper the yield curve. Thus, the yield curve is a sensitive indicator of investors' perception of risks in the future.
Now let's look at the yield curve, as measured by the spread (difference in yield) between the 10 year U.S. Treasury note and 90 day U.S. Treasury bills, plotted between 1982 and the present, courtesy of the Federal Reserve Bank of St. Louis FRED database.
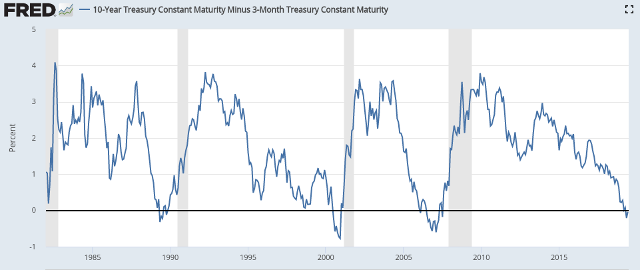
Note how the yield curve, measured by just these two points on the maturity of a single debt security, has varied over the years. At highs, it approaches 4%, while at lows—now that's interesting—it goes negative. What could that signify?
Well, at the simplest level, it means that investors are willing to accept a lower yield for locking their money up for ten years than simply parking it with the Treasury for 90 days. Are they crazy? What are they thinking?
This phenomenon, when the yield curve goes negative, is called an inverted yield curve. There are a number of possible explanations for it, but most of them do not bode well for the economy in the near future. If an investor anticipates an economic slowdown, that slowdown is likely to reduce the demand for capital and will be reflected in lower interest rates. Buying a longer-term bond allows “locking in” today's higher interest rate for the full time until the bond matures, regardless of where interest rates go during that period. If the investor stayed in short-term instruments, they would be rolled over periodically during that time and, if interest rates had fallen, would be renewed at lower yield, resulting in less income compared to the long-term bond. This preference causes investors to bid up the price of longer bonds compared to those with shorter terms, resulting in an inversion of the yield curve. In addition, investors anticipating the sharp drop in equity (stock) markets which often accompanies an economic downturn, may prefer to park their money in a risk-free bond which will provide a guaranteed stable return throughout the anticipated time of turbulence. Thus the yield curve reflects investor sentiment: when it is steeply positive (long rates well above short rates), investors are generally optimistic about the future and demand compensation in the form of higher interest rates for locking their money up and forgoing other opportunities. When they're less sanguine about what's coming, the prospect of not only a guaranteed rate of return on their money but also return of 100% of their money when the bond matures sounds like a pretty good deal compared to the alternatives (such as buying into a historically overpriced stock market late in an economic expansion cycle) and they're willing to accept a lower rate of interest to secure that return. (If you think this paragraph was tangled, check out the work of academic economists on the expectations hypothesis, which says more or less the same thing in intimidating mathematics. There are a number of competing theories to explain the yield curve, and, as usual, economists differ on which best explains the phenomenon.)
Whatever the motivations of investors which result in the rare occurrence of an inverted yield curve, that circumstance has been a reliable indicator of bad times just around the corner. Since 1970, shortly after the dawn of the era of pure paper money and the inflation and exchange rate instability it engendered, there have been eight periods where the yield curve went inverted based upon the monthly rates of 90 day and 10 year U.S. Treasury debt. Seven of these eight periods of yield curve inversion have been followed by economic recessions as declared by the National Bureau of Economic Research (NBER). The time between the onset of the yield curve inversion and the start of the recession has varied between 6 and 17 months, but a recession has always ensued. (Recessions are marked by the grey bars in the yield curve chart above.) Further, there has not been a single recession during that almost half century which was not preceded by an inversion of the yield curve.
“But, you said, ‘Seven out of eight times.’ What about the eighth?”
That's where it gets interesting, and newsworthy. After ten years in positive territory, the yield curve went negative in May, 2019 and has remained negative since then. If a recession does not follow this signal, it will be the first time it has failed to forecast a recession since 1970. An inversion of the yield curve does not forecast the date of onset of the recession or its severity, but history advises that if you're willing to bet a recession (with all of its sequelæ for the stock market, unemployment, budget deficits, and politics) will not start within 18 months or so after the inversion of the yield curve you must really believe that “this time is different”. That, of course, is what all of the sell-side analysts are telling you, but listen to them at your own risk.
My guess, and it's only a guess, is that there may be some financial turbulence ahead, including a media-hyped (but long-overdue) recession in the run-up to the 2018 elections in the U.S. This will, of course, be presented as evidence of the “failure of capitalism” and reason for the electorate to vote for whatever slaver nostrums are on the menu in that contest. There are other indications, still ambivalent, of a gathering storm: gold has just in the last week blown through its five year resistance level at US$1350/troy ounce and raced to more than US$1400, and Bitcoin has exploded to around US$11000/BTC. These are, no doubt, driven in part by fears of the war the Deep State is trying to gin up between the U.S. and Iran in order to take down Trump, but they may also limn the first signs of the inevitable consequences of the market's realisation that there is no consensus in Washington to do anything about the runaway deficits, debt, and inevitable insolvency of the U.S. government and the reserve currency it prints.
What is clear is that inversion of the yield curve is one of the most reliable indicators over the last fifty years that a period of “business as usual” is coming to an end. The indicator has now given its signal. It is prudent to consider the consequences and ponder how prepared you are for what may come next.
Posted at June 25, 2019 12:14