|
|
As we've seen in the Signal and Noise
chapter, it's possible to extract the information that's needed for
effective weight control, actual changes in weight, from daily weight
figures. In this chapter we'll turn to the mechanics of keeping track
of your weight and deriving the feedback you need from it.
The first step in getting control of your weight is putting the weight measuring system into effect: starting to wear an eat watch. Don't put it off; start right away, even if you aren't interested or ready to start dieting until later. By the time you do begin to diet, you'll be familiar with how your weight behaves, comfortable with the tools, and used to interpreting the messages they send.
To be useful, weight data should be reasonably accurate. The day to day variations in the rubber bag are bad enough without the scale getting into the act and adding its own two pounds. If you don't have a reasonably accurate scale, buy one. You don't need a super-expensive doctor's scale, but your scale should be accurate to a pound or so. Electronic scales that use a strain gauge instead of moving parts are cheap and plenty accurate; that's what I use.
Many scales read a little high or low all the time: what scientists call “systematic error.” As long as it's only a few pounds and remains the same, this is no problem as long as you always use the same scale. But if a scale reads high one day and low the next, it's yet another source of confusion: the last thing you need. Try stepping on a scale four or five times in succession. If it reads the same weight within a pound or so each time, it's fine. If the weight jumps all around, for example 170, 172, 168, 175 on successive weighings, junk it and get a better scale.
Keep in mind the variation among scales when you're traveling. If you're visiting a friend and happen to step on his scale and it says you've gained 10 pounds overnight, odds are it's the scale, not you.
The best way to keep your weight records is in a looseleaf binder. You could just use random pieces of paper, but you're far more likely to lose something that way. Even if you're keeping your records on a computer, you'll still need a logbook to record daily weights awaiting entry into the computer, and to file printed weight logs and charts from earlier months.
Get a three-ring looseleaf binder (a thin one is fine) and a package of index tabs. Make tabs for the following sections:
The “Daily Log” section is where you'll record the daily weight from the scale. Fill it with a year's supply of blank log pages. If you're using Excel, you can print the blank log pages at the same time you create the weight database for the year. Load the worksheet WEIGTEMP.XLS (it loads several other files automatically).
WEIGTEMP.XLS comes configured for monitoring weight in pounds. If you measure your weight in kilograms, enter 0 in the cell that displays “Pounds” in the “Weight” column; to specify your weight in stones, enter −1 in this cell. If you change the system of measurement, use FILE SAVE to update WEIGTEMP.XLS on your disc. When you create logs for subsequent years, then, the units you prefer will already be selected.
A new WEIGHT menu will appear at the right of the standard Excel menus. Pick NEW YEAR LOG from it. You'll be asked for the year you're making the log for (normally, you'll just use the default, the current year) and the month you'd like to start with, if not January. A new blank weight log worksheet is created, and you're asked to confirm saving it as WEIGHTyy.XLS, where “yy” is the current year (for example, the log for 1995 will be named WEIGHT95.XLS). If you prefer a different name, fine; just enter it instead of the name proposed in the FILE SAVE AS dialogue. Once the log worksheet for the year is saved, print it with FILE PRINT. Since you haven't entered any data yet, blank log pages suitable for recording your weight will be printed.
If you aren't using a computer, just run off a dozen photocopies of the following blank form and file them in the “Daily Log” section. Each month write the name of the month at the top of the form as you start to use it. You'll need to punch holes in the forms to file them in your logbook; buy a cheap three hole punch if you don't already own one.
                 _____________ ____

Date      Day      Weight      Trend      Rung
                               _____
 1       _____     ______      _____      ____
 2       _____     ______      _____      ____
 3       _____     ______      _____      ____
 4       _____     ______      _____      ____
 5       _____     ______      _____      ____
 6       _____     ______      _____      ____
 7       _____     ______      _____      ____
 8       _____     ______      _____      ____
 9       _____     ______      _____      ____
10       _____     ______      _____      ____
11       _____     ______      _____      ____
12       _____     ______      _____      ____
13       _____     ______      _____      ____
14       _____     ______      _____      ____
15       _____     ______      _____      ____
16       _____     ______      _____      ____
17       _____     ______      _____      ____
18       _____     ______      _____      ____
19       _____     ______      _____      ____
20       _____     ______      _____      ____
21       _____     ______      _____      ____
22       _____     ______      _____      ____
23       _____     ______      _____      ____
24       _____     ______      _____      ____
25       _____     ______      _____      ____
26       _____     ______      _____      ____
27       _____     ______      _____      ____
28       _____     ______      _____      ____
29       _____     ______      _____      ____
30       _____     ______      _____      ____
31       _____     ______      _____      ____
Keeping track of your weight takes less than a minute per day. Once your logbook is started, making the entries in it will quickly become part of your daily routine to the extent you hardly think about it any more.
Weight records are most useful if you record your weight every day, at the same time of day, under the same circumstances. The best time to weigh yourself is right after you awake for the day. Since you won't have eaten since going to sleep, your body will tend to have its most consistent weight at that time. Always weigh yourself dressed the same way. The easiest way to get consistent results is to weigh in stark naked.
If you keep the logsheet in a book near your scale, you won't forget to enter your weight every day.
Even if you're using the Excel worksheet as your permanent log, it makes sense to record your weight on paper. At the end of the month, you can spend 5 minutes entering the data into the spreadsheet from the paper log. You can, if you like, enter your weight into the computer every day but unless you're obsessed with tracking day-by-day results, it's much quicker to scribble the number on the paper sheet and enter a whole month's data in one swell foop. (Besides, people like me shouldn't consider touching a computer right after getting up—operating complicated machinery when possessed of the cognitive powers of a sea slug and the disposition of a polar bear with a toothache is most unwise.)
Keep the log for the current month on the first page of the “Daily log” section of your logbook. If you forget to weigh yourself or can't weigh in that day (for example, when you're traveling), make a note in the weight column of the log indicating what happened. Don't leave the column blank—that's likely to cause you to enter the next day's weight in the slot for the missing day and get the day and weight columns out of whack.
Here's a sample log filled out for the first two weeks of April 1989. This individual is using Excel, so he's left the “Trend” column blank; Excel will calculate it automatically when the log is copied to the worksheet.
                       April 1989

Date       Day      Weight    Trend   Rung
                               _____
 4/1/89   Saturday    145.5    _____    25
 4/2/89   Sunday      145.5    _____    25
 4/3/89   Monday      145.0    _____    25
 4/4/89   Tuesday     146.5    _____    26
 4/5/89   Wednesday   146.5    _____    26
 4/6/89   Thursday    145.0    _____    26
 4/7/89   Friday      146.0    _____    26
 4/8/89   Saturday    144.0    _____    26
 4/9/89   Sunday      145.5    _____    26
4/10/89   Monday      Travel   _____   ____
4/11/89   Tuesday     Travel   _____   ____
4/12/89   Wednesday   145.5    _____    25
4/13/89   Thursday    146.5    _____    25
4/14/89   Friday      145.0    _____    25
4/15/89   Saturday    140.5    _____    26
4/16/89   Sunday      _____    _____   ____
4/17/89   Monday      _____    _____   ____
4/18/89   Tuesday     _____    _____   ____
4/19/89   Wednesday   _____    _____   ____
4/20/89   Thursday    _____    _____   ____
4/21/89   Friday      _____    _____   ____
4/22/89   Saturday    _____    _____   ____
4/23/89   Sunday      _____    _____   ____
4/24/89   Monday      _____    _____   ____
4/25/89   Tuesday     _____    _____   ____
4/26/89   Wednesday   _____    _____   ____
4/27/89   Thursday    _____    _____   ____
4/28/89   Friday      _____    _____   ____
4/29/89   Saturday    _____    _____   ____
4/30/89   Sunday      _____    _____   ____
If you aren't using Excel, calculate the daily trend figure and enter it in the “Trend” column. You could calculate all the trend numbers at the end of the month, but it's better to spend a few seconds every day rather than look upon it as a page full of calculations to do each month. If you keep a cheap pocket calculator next to your logbook, you can calculate the trend in less time than it takes to write the number in the book.
If you're following the optional exercise program, record the level of exercise in the “Rung” column, right after you complete the exercises for the day. If you skip a day, or aren't participating in the exercise regime, leave the “Rung” entry blank.
At the end of the month, the log is used to produce a weight and trend chart and to calculate weekly weight loss or gain and the daily calorie shortfall or excess.
Excel performs all the calculation and charting automatically. If you aren't using Excel, skip to the next section for the equivalent manual calculations. Load the current year's database, created originally as described above, into Excel. The file name would be, by default, WEIGHT95.XLS for the year 1995. Scroll to the proper month and enter the data from the “Weight” column of the paper log into the corresponding cells of the worksheet. There's a little-known feature in Excel that makes entering tables of numbers like this easy. Select the Weight cell for the first day of the month by moving the mouse there and pushing the button. Then, without releasing the mouse button, drag the selection downward to the Weight cell for the last day of the month and then release the button. Now you can type the weight for each successive day of the month, right from the log sheet, pressing ENTER after each number; Excel automatically advances to the next cell in the column. If the weight is missing for a day, enter an explanatory word in the Weight cell, for example “Travel” or “Forgot.” Don't leave the Weight cell blank; Excel needs a non-number there to account for the missing weight.
If you've recorded exercise rung numbers in the “Rung” column of the log, transcribe them to the Excel worksheet in the same manner, except there's no problem with leaving missing entries in the Rung column, or the entire column, blank. Finally, if you're recording some other event relevant to your weight: participation in some sport or exercise program, days you skipped lunch, or whatever (see "Other exercise" in the What, Me Exercise? chapter), for every day you've flagged with a check mark to the right of the Rung column on the logsheet, enter a 1 in the “Flag” column of the worksheet; leave flag cells for unchecked days blank. Flag cells you mark with a 1 will display a check-off mark rather than the number 1 to make the function of the field clear.
Once you've transcribed the data from the paper logsheet to the Excel worksheet, save the worksheet to disc with FILE SAVE. Next, print a permanent logsheet containing the calculated trend with FILE PRINT. Enter the number of the month (1 for January, 2 for February, etc.) in both the From and To page boxes in the print dialogue, then click OK. Take the log sheet that emerges from the printer, check it against the original paper log, and if it's OK, three-hole punch the page and file it at the end of the “Monthly Logs” section in your logbook. The new sheet becomes part of the permanent record of your weight. Discard the original sheet on which you wrote your daily weight.
Now create the weight chart and analysis for the month by selecting any cell within the month (move the pointer there with the mouse and click), then choosing MONTHLY CHART from the WEIGHT menu. Excel will clank and grind for a few seconds, and render a chart unto you. Print a copy of the chart with FILE PRINT, three-hole punch the page, and file it at the end of the “Monthly Charts” section of your logbook. If you have plenty of disc space, you may want to save the chart as an Excel chart file: choose FILE SAVE AS and enter a name like “JUL90” to identify the chart file. If you don't wish to keep the chart file, choose FILE CLOSE and answer “No” to the “Save Changes” query—you can always regenerate the chart for any month by selecting a cell within that month and choosing WEIGHT MONTHLY CHART. The shortcut key CONTROL+m can be used to create a monthly chart instead of the WEIGHT MONTHLY CHART menu item, if you prefer.
Next, add the new month's data to the permanent weight and trend database by choosing UPDATE HISTORY from the WEIGHT menu. The new month is appended to the history worksheet, WEIGHIST.XLS, used for long-term chart generation. You can examine it directly by popping its window to the front with the WINDOW menu. If you forget to update the history database, don't worry; all data added since the last update will be copied into the history the next time you request an update, or automatically before any long term chart is generated.
Finally, save the updated weight worksheet with FILE SAVE and close it with FILE CLOSE. You're done with Excel for the month, and you can leave it if you like. This is an excellent time to make a backup of the files in your WEIGHT directory onto a floppy, label it with the date, and put the backup away in a safe place. Your lifetime weight database is too important to lose in a hard disc crash! Now you're ready to interpret the chart in conjunction with your weight control objectives. Turn to the “Monthly analysis” section below.
Excel User Monthly ChecklistIf you're keeping the log by hand and calculating the new trend number every day, when the end of the month arrives your logsheet is already complete. Simply move it from the “Daily Log” section of the logbook to the end of “Monthly Logs.” Copy the last number in the Trend column of the completed logsheet to the blank above the first day in the Trend column of next month's. Label the new month's logsheet with the month and year.
Next, calculate the rate of weekly weight loss or gain and the daily calorie deficit or excess from the first and last trend values of the month following the instructions in the Pencil and Paper chapter. Finally, plot a weight chart for the month, using the chart below as a model, as described in "Making weight charts". Write the weight loss or gain rate and calorie deficit or excess at the bottom of the chart and file it at the end of the “Monthly Charts” section of your logbook. Now it's time to look at the chart and see what it means.
Here's my own chart for July of 1990, generated automatically by Excel. If I'd plotted the chart by hand, it might not look as crisp, but the message would be no less clear.

The chart is presented in the “Floats and sinkers” form described in the Signal and Noise chapter. The heavy line is the weight trend; individual daily weights are plotted as diamonds with lighter lines tying them to the trend for that day. The exercise rung is plotted as a light dashed line with missing days blank (or the whole line absent if you've opted not to exercise). The weight scale, in pounds, is at the left while the right hand scale reads exercise rungs. At the bottom of the chart, a trend analysis appears.
This chart is easy to interpret. The analysis, as well as the trend line, indicates my weight was, for all intents and purposes, constant in July. The very slight downtrend of a tenth of a pound per week indicates I ate about 36 fewer calories per day than I burned, a shortfall I could remedy, if it bothered me, by eating the equivalent of one more pat of butter or slice of bacon per day.
Excel users can easily prepare long-term charts that show daily weight and the course of the trend over a number of months. From the WEIGHT menu, you can select any of the following of charts, illustrated here with my weight data from 1989.
WEIGHT QUARTERLY CHART plots data for the last three months:
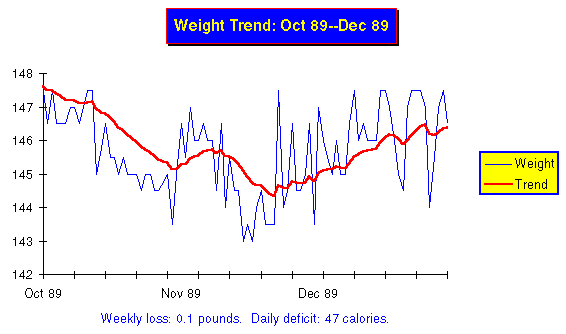
Long term charts show only the daily weight and trend, with the weight plotted as a thin blue line and the trend as a thick red one (obviously, you'll need a colour screen and/or printer to appreciate the colour, but you can tell the lines apart by their thickness even in black and white.)
WEIGHT SEMIANNUAL CHART shows the last six months in the same format as the quarterly chart.
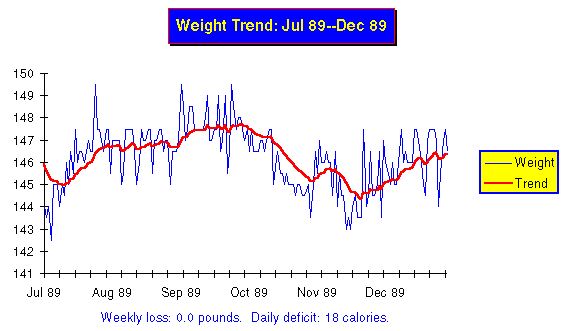
Notice how the longer term view changes the appearance of the chart. What looked like a reversal of trend on the quarterly chart now is seen more a part of a lazy drift back and forth around my weight goal of 145. For an even more distant view, choose WEIGHT ANNUAL CHART to plot the last 12 months.
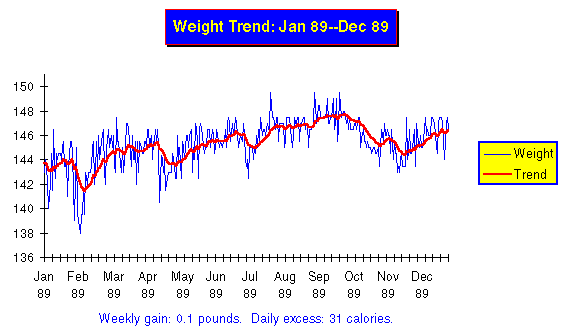
This shows that over all of 1989, as measured by the trend, my weight varied only from 142 through 147.5, and that the changes within that band were gentle. This is a picture of the eat watch in action: providing proportional negative feedback to keep my weight within a couple of pounds of the goal of 145.
You can make a chart of the entire historical database, back to the very first weight you entered, by selecting WEIGHT COMPLETE HISTORY CHART.
Obviously, you won't be able to produce a quarterly chart until you've collected three months of weight data, or a semiannual or annual chart until you have six or twelve. Be patient, let the data pile up, and before long you'll be able to review your progress over the months. File the long term charts you print in the “Long Term Charts” section of your logbook. You'll find them interesting to review on occasion, particularly as they come to document your weight loss and subsequent success in maintaining your goal.
If you're charting by hand, I don't recommend going to all the trouble of re-plotting to make long term charts. The easiest way to obtain a longer view is to remove the charts for a series of months from your logbook and arrange them, overlapping one another, on your desk or on the floor, to form a wide chart. Be sure to line up the charts so the same weight is at the same place on the vertical grid. You can also photocopy the monthly charts then tape the copies, properly aligned, into a scroll. You can unwind the scroll to see any long term view you like. If you do decide to plot long term charts, don't bother with the daily weights. Just plot the trend, since plotting the daily weights doubles the time and makes the resulting graph look “busy.” The daily weights contribute nothing to the analysis; the Excel macros plot them because it takes no longer for the computer to do it, and it's interesting to see the long term relationship between the weight and trend.
At the end of the year, make up a new year's supply of blank daily log sheets. Excel users should simply repeat the procedure used to make the first batch. When the new WEIGHTxx.XLS worksheet appears, copy the last trend number from the previous year's log (the Trend entry for December 31st) and enter it in the Trend column of the new year's log on the line above the January 1st entry labeled “Trend carry forward.” This lets the trend for the new year continue right where it ended the previous year. Once that's done, save the blank log worksheet for the new year and use FILE PRINT to print the logsheets for the next year; file them in the “Daily Log” section of the logbook. Be sure to make a floppy disc backup of everything in the WEIGHT directory and save the backup in a safe place. Should your weight records fall victim to a hard disc disaster, you need only reload the most recent backup and re-enter the data for the subsequent days from the logsheets.
If you're keeping records manually, just copy some more blank log sheets for the new year and continue to carry the trend from the last day of each month onto the new month's log as before.
The end of the year is an excellent time to sit back and review the charts for the preceding twelvemonth. Looking back over the changes in your weight over that time, whether quick loss as you removed weight, minor fluctuations after achieving stability, or an upward creep when something disturbed the balance, and reflecting on the events at those times, how you felt, and how you reacted to the changes, will increase your understanding of how weight affects you and, more importantly, how you can affect it.
|
|