| Total control runs: | 232063 | |
| Total tries: | 237632512 | |
| Total hits: | 118810591 | |
| Overall z: | 0.7350 | standard deviations |
Since each experiment involves 1024 bits, the total number of “Tries” in the next line is 232063×1024, or 237632512. Examination of the bit sequences shows that 118810591 of the total of 237632512 bits were ones. There were, then, 5665 fewer one bits among a total of 237632512 than the most probable chance expectation. This is equivalent to changing one zero bit in every 41947 bits to a one. The measured bias amounts to 0.7350 standard deviations.
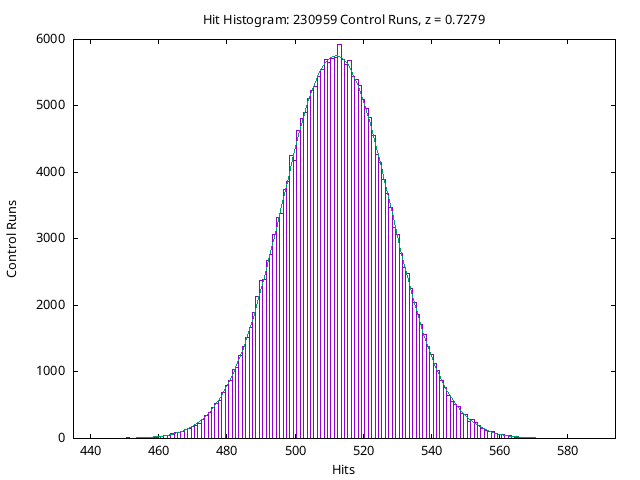
The following chart summarises the results of all control run experiments since control runs were begun on December 26, 1997.
The blue curve gives the normal distribution for a large number of trials of 1024 events with probability 0.5. (For a number of trials as large as 1024, the binomial and normal distributions are equal on the scale of this plot.) The red boxes show the actual number of experimental runs which resulted in the given number of one bits in the 1024 bit stream generated for each control run.
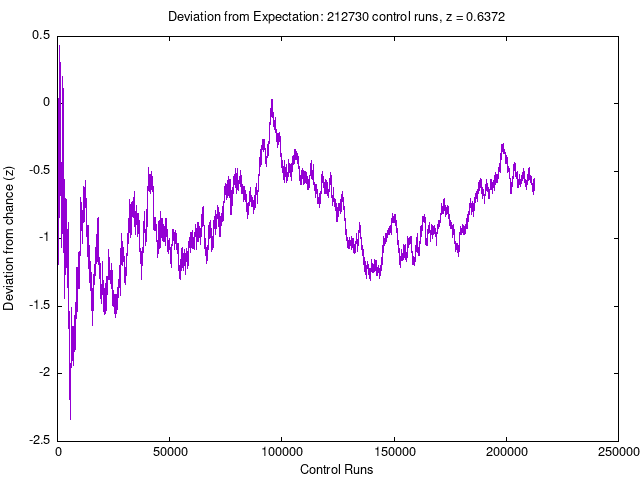
Any experiment involving a random data source can be expected to, in the absence of perturbing influences, follow a random walk around the most probable value. As the number of experiments increases, overall divergences should decrease. When examining the results of such experiments, it's important to satisfy yourself that any non-chance effect you observe doesn't result from the experimenter choosing to show you results at a peak or trough of a series which is swinging to both sides of the chance expectation with a mean value equal to chance. The following is a deviation plot of the all 232063 RPKP control runs to date; it shows the absolute divergence of the experimental results in the direction of bias preselected by the subject compared to that expected by chance, and the divergence in terms of standard deviations for the cumulative number of trials for a probability of 0.5 on each trial.
|
|
 RetroPsychoKinesis Project Home